Showing posts with label Knowyourstocks. Show all posts

Tuesday, March 2, 2021

MER Key Fundamental and Technical Indicator as Mar 02, 2021

Latest news today is that their net core income drop by 9%. I see that technically, the trend seems to be in bearish mode. 

See more on the video;


Friday, July 24, 2020

Is GTCAP fundamentally and technically sound to buy based on their March 2020 financial report and current price?

GT Capital Holdings, Inc. (GTCAP) was incorporated on July 26, 2007 as a holding company. GTCAP is the primary vehicle for the holding and management of the diversified business interests of the Ty family in the Philippines. The Company holds interests in banking; automotive assembly, importation, distribution, and financing; property development; life and non-life insurance; and infrastructure and utilities. 


GTCAP's subsidiaries are Federal Land, Inc.; Toyota Motor Philippines Corporation; Toyota Manila Bay Corp.; and GT Capital Auto Dealership Holdings, Inc. The Company also has significant shareholdings in Metropolitan Bank & Trust Company; Metro Pacific Investments Corporation; Philippine AXA Life Insurance Corporation; Toyota Financial Services Philippines Corporation; and Sumisho Motor Finance Corporation.


As of July 23, 2020, GTCAP was last traded at 438php per share, down by 55% compared to their 52-week high price. What valuation can we get from their March 2020 quarterly report?


Trailing P/E: 438/91.6= 4.8 Indicating that for every 1php income last 2019, investors are willing to pay or are paying 4.8php only. It is said that an overvalued company would be the one trading at a rate that’s 50 times earnings, or this could be a gauge on how optimistic are investors on this company. A lower P/E may imply low in optimism perhaps due to lower expectations on future earning, or news i.e pandemic that greatly impacts investor optimism. 


For a growth rate of 56.9% change in EPS from 2018 to 2019, the PEG ratio would be 4.8/56.9=0.08 meaning, investors are paying 4.8php per earning relative to the growth rate of 56.9% from 2018 to 2019. A PEG ratio of less than 1 is usually considered undervalued.


Price to Book Value per share (P/B) = 438/760.14= 0.57, meaning, the current market price per share is 42.4% lower compared to the real worth of the company as based on their March 2020 financial report. A P/B of less than 3 is potentially undervalued


However, due to pandemic, their first 3 months net income dropped by 25.7%


Still, fundamentally, based on the parameters above, this share seems to be a good buy to accumulate.


However technically, the MACD seems to indicate bearish momentum. RSI also continues to move to an oversold level, it may be a good strategy to buy this stock while in a bearish mode as this will definitely bounce back. Caveat 

Monday, July 20, 2020

Is ALI fundamentally and technically sound to buy based on their March 2020 financial report and current price?

Ayala Land, Inc. (ALI) was formerly the real estate division of Ayala Corporation (AC) and was incorporated on June 30, 1988 to focus on the development of its existing real estate assets. In July 1991, the Company became publicly-listed through an initial public offering of its primary and secondary shares on the Makati and Manila Stock Exchanges.


ALI is engaged in the planning and development of large scale, integrated estates having a mix of use for the sale of residential lots and buildings, office buildings and commercial and industrial lots, leasing of commercial and office spaces and the development, operation and management of hotels and resorts. The Company also develops commercial and industrial parks and is also engaged in property management, construction and other businesses like retail and healthcare. 


Among the Company's subsidiaries are Alveo Land Corporation; Avida Land Corporation; Ayala Property Management Corporation; Makati Development Corporation; North Triangle Depot Commercial Corporation; Laguna Technopark, Inc.; and Ten Knots Philippines, Inc.


As of July 17, 2020, ALI was last traded at 31.7php per share, down by 3.65% from the previous trading. What valuation can we get from their March 2020 quarterly report?


Trailing P/E: 31.7/2.25= 14 Indicating that for every 1php income last 2019, investors are willing to pay or is paying 14php. It is said that an overvalued company would be the one trading at a rate that’s 50 times earnings, or this could be a gauge on how optimistic are investors on this company. A lower P/E may imply low in optimism perhaps due to lower expectation on future earning, or news i.e pandemic that greatly impact investor optimism. 

For a growth rate of 13.6% change in EPS from 2018 to 2019, the PEG ratio would be 14/13.6=1 meaning, investors are paying 14php relative to the growth rate of 13.6% from 2018 to 2019. A PEG ratio of less than 1 is usually considered undervalued, in this case, the market price seems to be just right relative to growth rate 
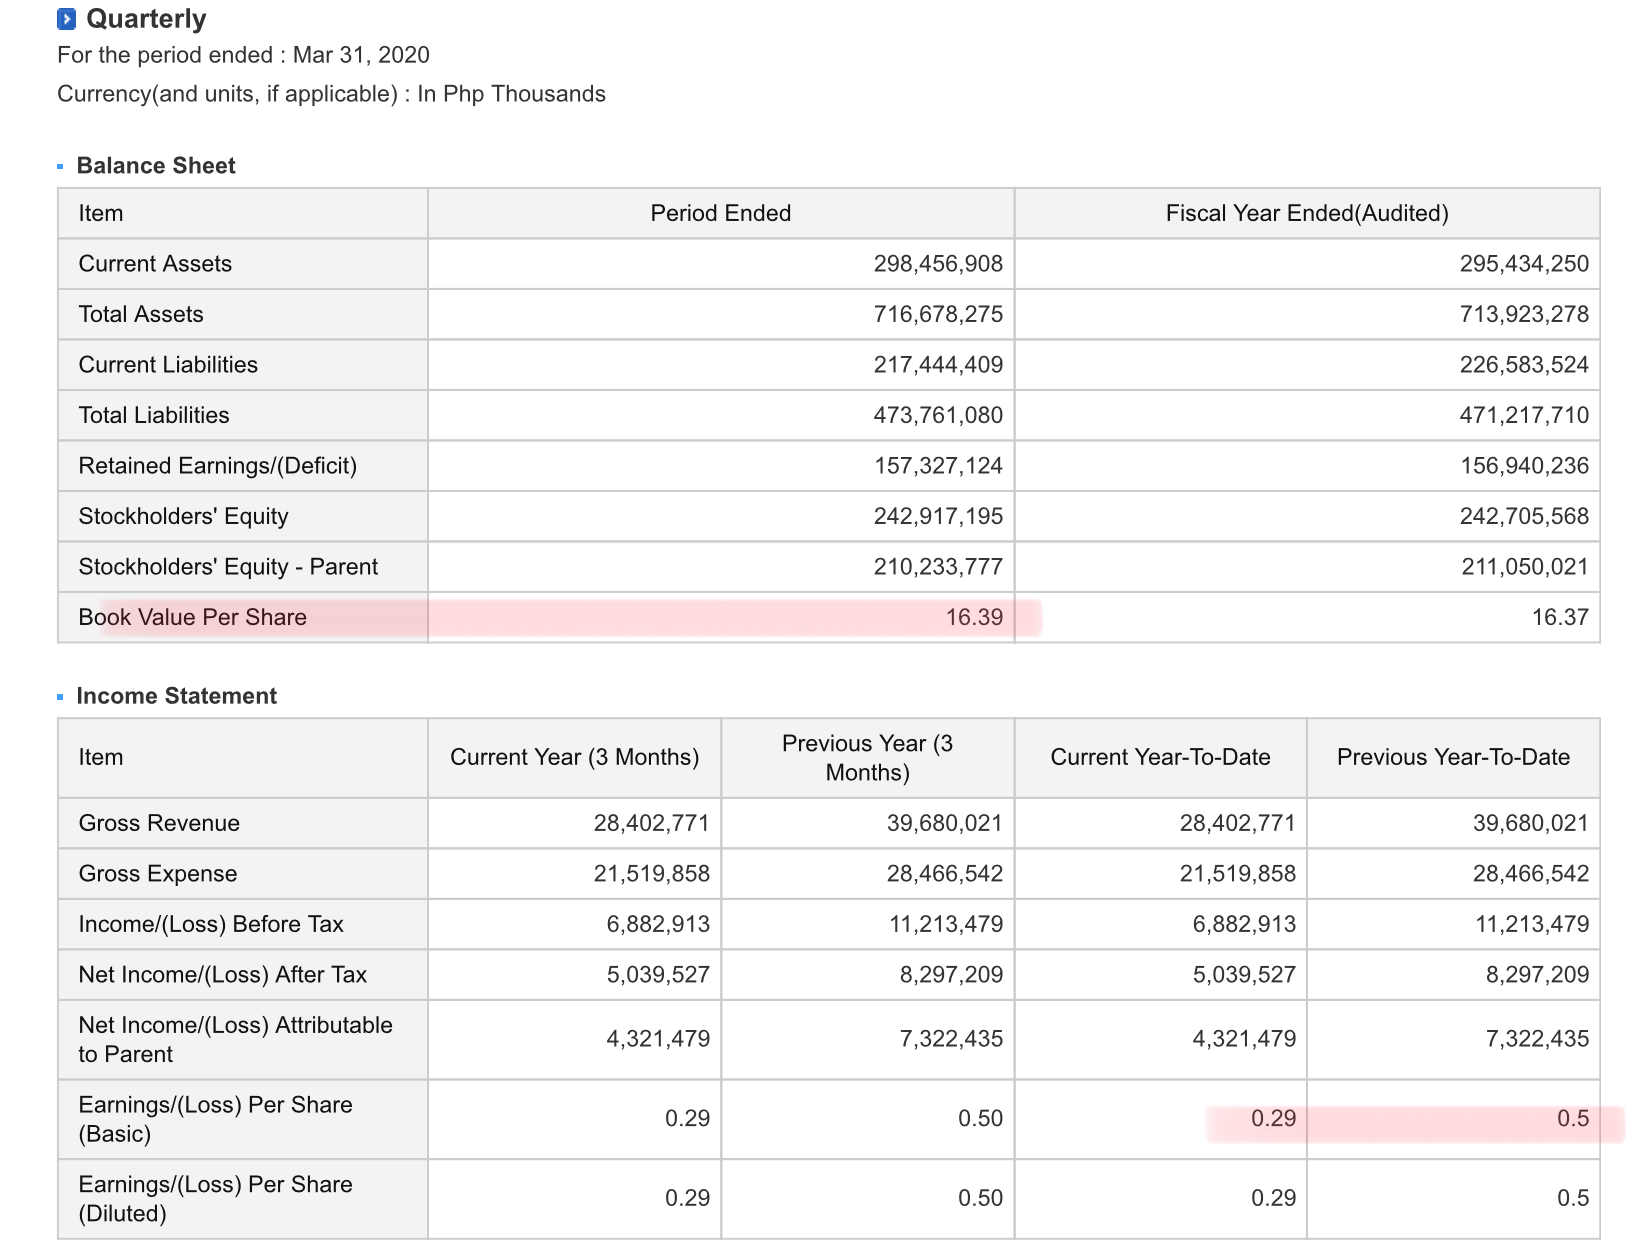
Price to Book Value per share (P/B) = 31.7/16.39= 1.9, meaning, the current market price per share is around 1.9 times higher compare to the real worth of the company as based on their March 2020 financial report. A P/B of less than 3 is potentially undervalued.


However, due to pandemic, their first 3 months net income dropped by 41%, still fundamentally, based on the parameters above, this share seems to be a good buy. 


However technically, the MACD seems to indicate a bearish momentum. RSI also continues to move to an oversold level. If I’m to buy this share, I’ll wait few more trade to see whether the momentum has a sign of reversal to bullish mode.


Disclaimer: Trade or invest at your own risk.

Friday, July 17, 2020

PSE Companies Issuing Dividend for Month of July 2020


Source: PSE edge


FAQ about Dividends


Q1. What is Ex dividend Date?


A1. It means the date set by the Exchange starting from which the buyer is no longer entitled to the dividends. Currently set at 3 business days before record date.


Q2: What if I buy stocks before Ex dividend date, will I be entitled for the dividend?


A2. Yes, but if you purchase a stock on the ex-dividend date or after, you will not receive the next dividend payment. Instead, the seller gets the dividend. If you purchase before the ex-dividend date, you get the dividend.


Q3: What if I buy stocks before ex dividend date but sell it before the record date or payment date, will I still be entitled for the dividend?


A3: Yes you will still be entitled, but note that by the time the stock is sold, it will decline in value by the amount of the dividend. The broker will get the commission and the buyer might just break even.


Why does the stock price decline right after the dividend is paid? Because that's the way the markets work.


Key Takeaways


- When a stock dividend is paid, the stock's price immediately falls by a corresponding amount.


- The market effectively adjusts the stock's price to reflect the lower value of the company, which could wipe out any gain sought by a short-term buyer.


- In addition, the buyer owes taxes on those dividends.


Click here for the source


Q4: What is record date?


A4: It means the date on which stockholders must officially own shares in order to be entitled to any shareholders rights or dividends, but if you buy share on this date, you will not be entitled, you must buy before ex dividend date to be entitled. 

Thursday, July 16, 2020

Is EW fundamentally and technically sound to buy based on their March 2020 financial report and current price?

East West Banking Corporation (EW) was registered with the Securities and Exchange Commission on March 22, 1993. The Company was granted authority by the Bangko Sentral ng Pilipinas (BSP) to operate as a commercial bank in 1994 and commenced operations on July 8 of the same year. 


EW's principal banking products and services include deposit-taking, loan and trade finance, treasury, trust services, credit cards, cash management and custodial services. The Company offers the financial services to consumer and corporate clients. On January 25, 2012, EW obtained from BSP the approval to operate as a universal bank.


On May 6, 2016, EastWest and Standard Chartered Bank Philippines (SCB PH) entered into an agreement for SCB PH’s retail business. Under the agreement, the credit cards, personal loans, wealth management and deposits of SCB in the Philippines will be migrated to EastWest.


The Company's wholly-owned subsidiaries are East West Rural Bank, Inc.; East West Insurance Brokerage, Inc.; Quest Marketing and Integrated Services, Inc.; East West Leasing and Finance Corporation, and Assurance Solutions Insurance Agency. EW also owns 50% of East West Ageas Life Insurance Corporation, a life insurance firm formed with Ageas Insurance International N.V.


As of December 31, 2018, EW has a network of 390 branches and 583 automated teller machines, majority of which are located within Metro Manila.


As of July 15, 2020, EW was last traded at 7.37php per share. What valuation can we get from their March 2020 quarterly report?


Trailing P/E: 7.37/2.77= 2.6 Indicating that for every 1php income last 2019, investors are willing to pay or is paying 2.6php only. It is said that an overvalued company would be the one trading at a rate that’s 50 times earnings, or this could be a gauge on how optimistic are investors on this company. A lower P/E may imply low in optimism perhaps due to lower expectation on future earning, or news i.e pandemic that greatly impact investor optimism.


For a growth rate of 38.5% change in EPS from 2018 to 2019, the PEG ratio would be 2.6/38.5=0.06 meaning, investors are paying 2.6php relative to the growth rate of 38.5% from 2018 to 2019. A PEG ratio of less than 1 is usually considered undervalued.


Price to Book Value per share (P/B) = 7.37/22.74= 0.3, meaning, the current market price per share is 67.5% lower compare to the real worth of the company as based on their March 2020 financial report. A P/B of less than 3 is potentially undervalued


In spite of pandemic, their first 3 months net income increase by 74.7%.


Fundamentally, based on the parameters above, this share seems to be a good buy to accumulate. Once the pandemic is over, this share will eventually catch up to its real worth.
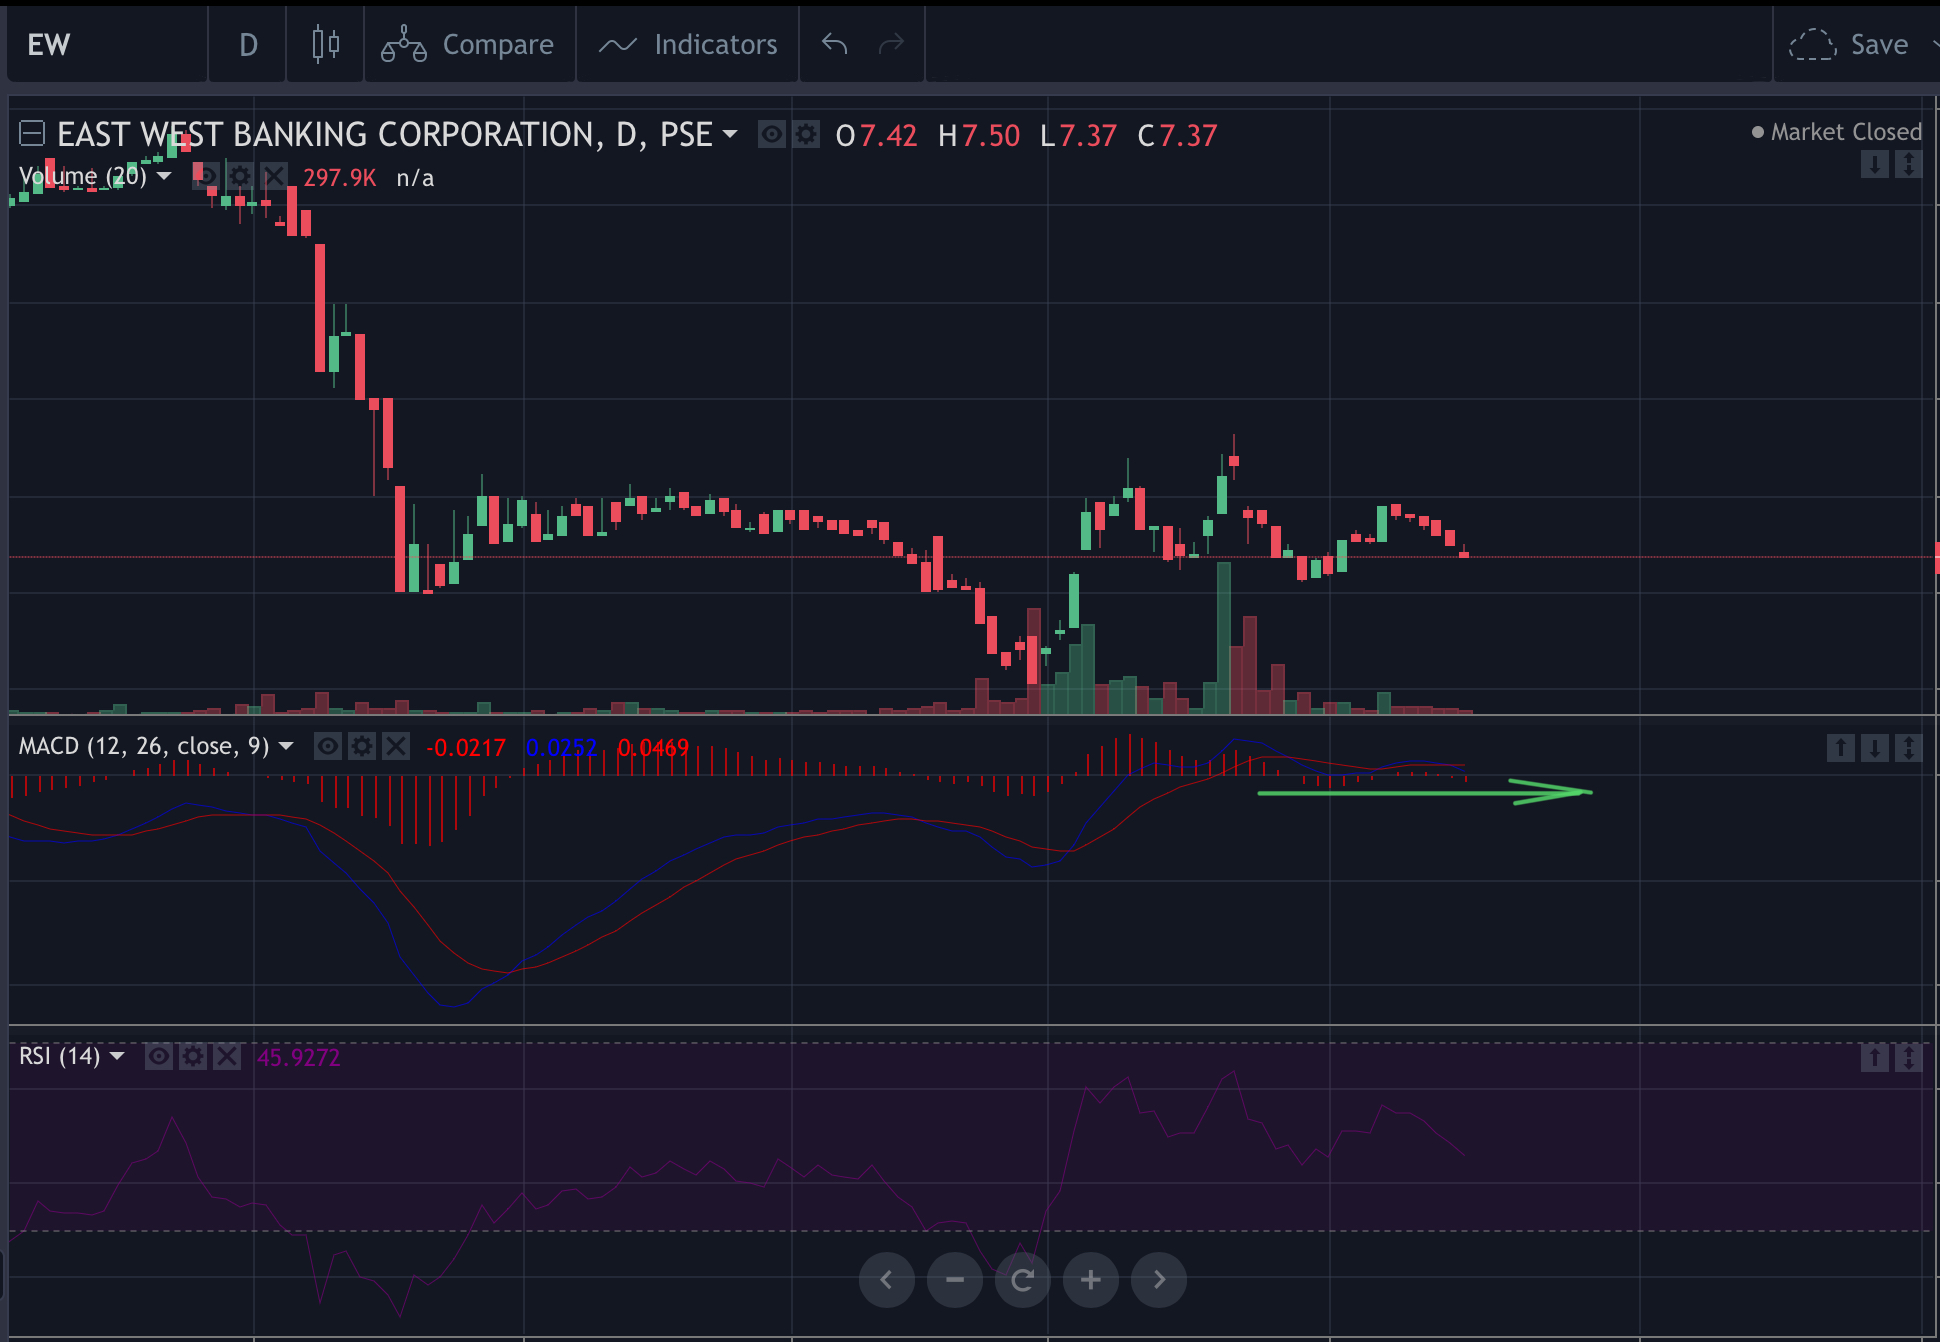

However technically, the MACD histogram seems to indicate a sideway momentum. If you are into longterm investing, I suggest you accumulate this share.


Disclaimer: Trade or invest at your own risk.

Tuesday, July 7, 2020

Is FGEN fundamentally and technically sound to buy based on their March 2020 financial report and current price?

First Gen Corporation (FGEN) was incorporated and registered with the Securities and Exchange Commission on December 22, 1998. FGEN and its subsidiaries are involved in the power generation business. FGEN is the largest clean and renewable Independent Power Producer in the Philippines, with a total installed capacity of 3,490 MW as of December 31, 2018. 


The Company owns power plants which utilize natural gas, geothermal, wind, hydro and solar power, all of which are operational and majority-owned and controlled by the Company through its subsidiaries. These subsidiaries include First Gas Power Corporation, FGP Corp., First NatGas Power Corp., Prime Meridian Powergen Corporation, FG Bukidnon Power Corporation, and Energy Development Corporation.


As of December 31, 2018, First Philippine Holdings Corporation directly and indirectly owns 66.98% of the common shares of FGEN and 100% of FGEN's voting preferred shares. Lopez, Inc. is the ultimate parent company of FGEN.


As of July 6, 2020, FGEN was last traded at 25.7php per share or 0.52USD. What valuation can we get from their March 2020 quarterly report?

Trailing P/E: 0.52/0.07= 7.4 Indicating that for every 1USD income last 2019, investors are willing to pay or is paying 7.4USD. It is said that an overvalued company would be the one trading at a rate that’s 50 times earnings, or this could be a gauge on how optimistic are investors on this company. A lower P/E may imply low in optimism perhaps due to lower expectation on future earning. 


For a growth rate of 40% (change in EPS from 2018 to 2019), the PEG ratio would be 7.4/40=0.19 meaning, investors are paying 7.4USD relative to the growth rate of 40% from 2018 to 2019. A PEG ratio of less than 1 is usually considered undervalued.


Price to Book Value per share (P/B) = 0.52/0.61= 0.8, meaning, the current market price per share is 14.7% lower compare to the real worth of the company as based on their March 2020 financial report. A P/B of less than 3 is potentially undervalued


The first 3 months net income dropped by 19.6%. 


Fundamentally, based on the parameters above, this share seems to be a good buy.


However technically, the MACD histogram seems to indicate a decline in momentum  prompting profit taking. Meanwhile, RSI also already reach the overbought level signalling a downward momentum


Disclaimer: Trade or invest at your own risk.

Friday, July 3, 2020

Is MM current market price justified fundamentally?

MerryMart Consumer Corp. (MM), formerly Injap Supermart Inc., is a consumer-focused retail company principally engaged in the operation of retail stores in the supermarket and, beginning January 30, 2020, household essentials category. MM, through its subsidiary, MerryMart Grocery Centers Inc. (MMGC) intends to pioneer the franchise business model covering supermarkets and household essentials stores in the Philippines (collectively, MM and its subsidiary, MMGC, are known as the 'MM Group').


Currently, the MM Group owns and operates seven MM branches nationwide, with an aggregate selling space of 9,331 square meters. The MM Group aims to open six more MM branches by the second quarter of 2020, six additional branches by the third quarter of 2020, and have a total of 100 branches located all over the Philippines by the fourth quarter of 2021.


MM is a wholly-owned subsidiary of Injap Investments Inc., which also owns 35% of DoubleDragon Properties Corp.


As of July 2, 2020, MM was last traded at 3.29php per share. This company was recently listed last June 15, 2020, and released their first quarter report the other day. What valuation can we get from their March 2020 quarterly report?


Trailing P/E = 3.29 / 0.03 = 109.6 Indicating that for every 1php income last 12 months, investors are willing to pay or is paying 109.6php. It is said that an overvalued company would be one trading at a rate that’s 50 times earnings, or it could be an optimism whereby investors expect earnings growth in the coming quarters and, as a result, investors have been buying the stock in anticipation of its appreciation. MM nature of business is like of that PGOLD and RRHI which are companies that are already established, the P/E’s of these companies are below 20, yet MM P/E is above 100. Having said this, I say that the expectation is a bit much, thus it’s potentially overvalued.


Price to Book Value per share (P/B) = 3.29 / 0.07 = 47, meaning, the current market price per share is 47 times higher that the real worth of the company as based on their March 2020 financial report. A P/B of more than 3 is potentially overvalued.


Even though the net income for the first 3 months this year increased by 50.5% from the last year first 3 months, still, based on the P/E comparing it with established companies, the current price seems to be not justified, not to mentioned the P/B ratio.


Disclaimer: Trade or invest at your own risk.

Is DITO fundamentally and technically sound to buy?

DITO CME Holdings Corp. (DITO), formerly ISM Communications Corporation (ISM), was originally a mining company incorporated in March 1925 under the name Itogon-Suyoc Mines, Inc. As ISM, the Company was engaged in information technology, multimedia telecommunications, and other similar industries. On March 6, 2020, the Securities and Exchange Commission (SEC) approved the change in corporate name to the present one. 


DITO currently has no operating business. The Company is doing business as a holding company as it was since 2016.


On December 10, 2019, the Board of DITO approved the acquisition of Udenna Communications Media and Entertainment Holdings Corp.


As of July 2, 2020, DITO was last traded at 3.44php per share. Its market price is 51.4% lower from its 52 week high. Is this fundamentally cheap and technically time to buy? 

Trailing P/E is negative because of the loss in income last 2019 and even in 2018. Investors buying stock in a company with a negative P/E should be aware that they are buying shares of an unprofitable company and be mindful of the associated risks. 


Technically, the MACD histogram is indicating a decline in momentum, thus we might see a continuation in profit taking, the same goes with RSI indicator.


Disclaimer: Trade or invest at your own risk.

Thursday, June 11, 2020

How expensive is BLOOM fundamentally based on their March 2020 financial report?

Bloomberry Resorts Corporation (BLOOM), formerly Active Alliance, Incorporated, was registered with the Securities and Exchange Commission (SEC) on May 3, 1999. BLOOM was a manufacturer of consumer communication and electronic equipment operating in Subic Bay Freeport Zone until 2003, when it suspended business operations. In February 2012, the SEC approved the change in its corporate name to the present one and the change in its primary purpose to that of a holding company for hotel and/or gaming and entertainment business companies.

The Company is the owner and operator (through its subsidiaries) of Solaire Resort & Casino (Solaire), the first integrated resort at the Entertainment City in Parañaque City, Metro Manila. The Company has marketing presence in Korea, Macau, Hong Kong, Singapore, Malaysia, Indonesia, Thailand, Taiwan and Japan.

The subsidiaries of the Company are: Sureste Properties Inc. (SPI), which owns and operates the hotel and other non-gaming facilities in Solaire; Bloomberry Resorts and Hotels, Inc., which has a gaming license from the Philippine Amusement and Gaming Corporation, and owns and operates the casino in Solaire; Solaire Korea Co. Ltd. and its subsidiaries Golden & Luxury Co., Ltd., which owns, and has a gaming license to operate, Jeju Sun Hotel & Casino, and Muui Agricultural Corporation, which owns prime real estate in Muui Island in Korea; and Bloom Capital B.V., which owns Solaire de Argentina S.A.


As of June 10, 2020, BLOOM was last traded at 7.88php per share. BLOOM is one of the listed company. It’s market price dropped by at least 30% from it’s 52 week high, largely because of the COVID19 pandemic, but is it now fundamentally cheap to buy?
In terms of P/E, BLOOM recorded a trailing P/E of 8.76, meaning, for every 1PHP earning last 2019, investors of this company are willing or is paying 8.76php. With a 8.76 P/E and with a growth rate of 38.4% (change in EPS) from 2018 to 2019, the company trailing PEG ratio would be just 0.23, which would be considered undervalued since a PEG ratio that is less than 1 is generally considered undervalued.


In terms of book value per share, the current market price is currently 2 times higher than the book value as recorded in their March 2020 financial report, meaning the company is perceived to be 2 times higher compare to the real worth of the company. It seems in terms of this parameter, I say it’s still in the range of undervalued.

In terms of income, as per their March 2020 financial statement, expectedly due to COVID19, the income dropped by 37%.

Is this a good stock to accumulate fundamentally in this pandemic period? Based on the indicators above, it suggest that it is fundamentally cheap to buy in this pandemic period.

Disclaimer: Trade or invest at your own risk.

Monday, October 16, 2017

How Expensive is SM Prime Holdings, Inc. (SMPH) now fundamentally based on their June 2017 Quarterly Report?

SM Prime Holdings, Inc. (SMPH) was incorporated on January 6, 1994 to acquire and develop real estate, conduct and maintain commercial shopping centers including shopping center spaces for rent, amusement centers, movie or cinema theaters, and to construct and manage buildings such as condominium, apartments, hotels, restaurants, stores and other structures for mixed use purposes. The Company has now four business units, namely, malls, residential, commercial, and hotels and convention centers.

As of December 31, 2016, SMPH has 60 malls in the Philippines and seven shopping malls in China. The malls in China are located in the cities of Xiamen, Jinjiang, Chengdu, Zibo, Chongqing, Tianjin, and Suzhou. The Company has 33 residential projects, 31 of which are in Metro Manila and two in Tagaytay. SMPH also owns Sky Ranch, an amusement park that was first launched in Tagaytay, adjacent to the Taal Vista Hotel, and later replicated within SM City Pampanga in the City of San Fernando.

Among the Company's subsidiaries are SM Development Corporation; Costa del Hamilo, Inc.; Highlands Prime, Inc.; Tagaytay Resort and Development Corporation; SM Arena Complex Corporation; SM Hotels and Conventions Corp.; and SM Land (China) Limited.


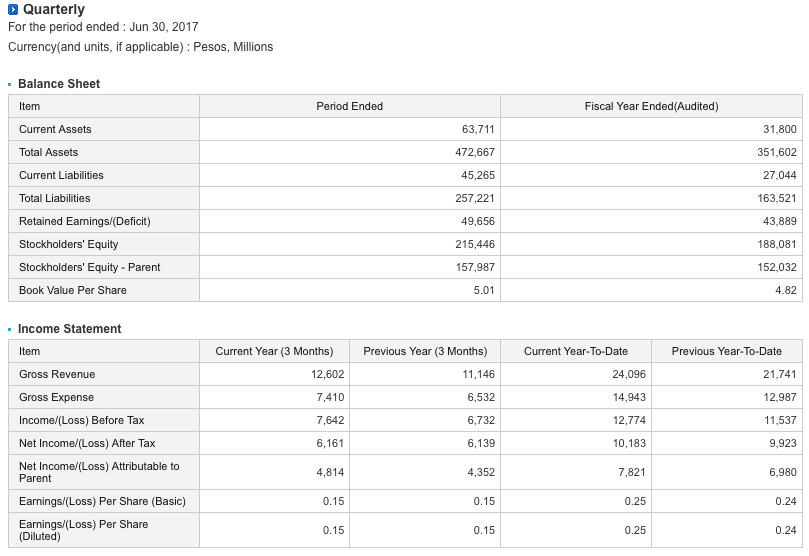
As of Oct 13, 2017, SMPH was last traded price at 36.5Php. This is 4.38 times higher compared to the recorded book value as according to their June 2017 quarterly report. In terms of this parameter, a value investor may find the market price expensive already but on the others hand, the investors may be seeing something that leads them to believe that the company should be worth 4.38 times higher than what it's really worth perhaps, they see potential earning in the future or other else.

In terms of P/E, the company recorded a trailing P/E of 43.98 meaning, for every 1PHP earning last 2016, investors of this company are willing or is paying 43.98Php. In terms of P/E, it seems like it's also overvalued but, how does the P/E value paired with the company growth rate? With a drop of growth rate from 2015 to 2016, the company trailing PEG ratio would be negative which means, investors of this company are paying 43.98Php for every 1PHP income last 2016 even if the company losses from 2015 to 2016. A value investor may find this share to be overvalued given the fundamental parameters as highlighted above.

The first 6 months net income attributable to parent this year increased by 14.2% in comparison to last year first 6months net income.

Disclaimer: Trade or invest at your own risk.

<P.S> Are you in Singapore? Confused and hardly able to understand what I'm talking about? Let's meet up, it's a free discussion. Click here to see the event.

Friday, October 13, 2017

How Expensive is Harbor Star Shipping Services, Inc. (TUGS) now fundamentally based on their June 2017 Quarterly Report?

Harbor Star Shipping Services, Inc. (TUGS) was registered with the Securities and Exchange Commission (SEC) on July 5, 1988 under the name Seatows, Inc. The Company's primary purpose is to engage in ocean towage, commerce and navigation in the carriage of goods and passengers by water upon the oceans, seas, sounds, lakes, rivers, canals, bays, harbors, and other waterways between the various ports of the Philippines and between such ports and other ports in the world.

The Company's service lines include harbor assistance, lighterage, towing, ship salvage, marine construction, repair and maintenance works, and other marine services. On August 11, 2015, TUGS secured the approval of the SEC to expand its business scope to include international marine commerce; manning, recruitment, ship and crew management; operate liner/feeder vessels and logistics operations; invest in, develop, manage and/or operate in domestic and international shipyards, ports and terminals; construction and rehabilitation of marine facilities; and real estate development.

TUGS has two subsidiaries, Harbor Star Subic Corp., which offers marine-related ancillary services such as harbor assistance, towage, lighterage, oil spill response and underwater marine services; and Peak Flag Sdn Bhd, a company incorporated in Malaysia to provide tugboat harbor assist/marine support services at the North and Kuantan Ports.

As of December 31, 2016, TUGS has operations in 15 base ports all over the country. The major ports that TUGS services include the Manila International Container Terminal, Bataan, Batangas, Cagayan de Oro, and Davao. The Company maintains and manages a fleet of 40 tugboats, five barges, a cargo vessel, an oil spill response vessel, and an anchor handling tug supply vessel.


As of Oct 13, 2017, TUGS was last traded price at 2.3Php. This is just 0.89 times lower compared to the recorded book value as according to their June 2017 quarterly report. In terms of this parameter, a value investor may find the market price to be quite a bargain.

In terms of P/E, the company recorded a trailing P/E of 12.78 meaning, for every 1PHP earning last 2016, investors of this company are willing or is paying 12.78Php. In terms of P/E, it seems like it's also in the range of not expensive yet now, let us take a look further on the company PEG ratio. With the P/E value and with a growth rate of just 38.46% from 2015 to 2016, the company trailing PEG ratio would only be 0.33 which means, investors of this company are paying 12.78Php for every 1PHP income last 2016 for a growth rate of 38.46%. It seems like, in terms of this parameter, a value investor may also find this share undervalued since the PEG ratio is less than 1.

You must be wondering, if the fundamental is good then why does the trend seems bearish? Well, I cannot really be certain, my best guess is because of its income. The first 6 months net income attributable to parent this year drop by 34.46% in comparison to last year first 6months net income. If the income trend continues to drop until the end of the year, the growth rate in comparison to 2016 would be negative hence, the PEG ratio next year will not be that attractive.

Disclaimer: Trade or invest at your own risk.

<P.S> Are you in Singapore? Confused and hardly able to understand what I'm talking about? Let's meet up, it's a free discussion. Click here to see the event.

Wednesday, October 11, 2017

How Expensive is Alliance Global Group, Inc. (AGI) now fundamentally based on their June 2017 Quarterly Report?

Alliance Global Group, Inc. (AGI) was incorporated on October 12, 1993 and listed its shares on the Philippine Stock Exchange on April 19, 1999. AGI began operations in 1994 as a glass-container manufacturer after it acquired a glass manufacturing plant in Canlubang, Laguna. In 1999, the Company obtained approval from the Securities and Exchange Commission to broaden its primary business into that of a holding company. 

AGI is presently engaged in the food and beverage business (manufacturing and trading of consumer products); real estate (investment in and development of real estate, lease of properties, hotel operations and tourism resorts business); tourism-entertainment and gaming; and quick service restaurant business.

AGI's subsidiaries include Emperador Inc.; Megaworld Corporation; Travellers International Hotel Group, Inc.; and Golden Arches Development Corporation.


As of Oct 11, 2017, AGI was last traded price at 16.68Php. This is just 0.66 times lower compared to the recorded book value as according to their June 2017 quarterly report. In terms of this parameter, a value investor may find the market price to be quite a bargain.

In terms of P/E, the company recorded a trailing P/E of 11.42 meaning, for every 1PHP earning last 2016, investors of this company are willing or is paying 11.42Php. In terms of P/E, it seems like it's also in the range of not expensive yet but, let us take a look further on the company PEG ratio. With the P/E value and with a growth rate of just 5.8% from 2015 to 2016, the company trailing PEG ratio would be 1.97 which means, investors of this company are paying 11.42Php for every 1PHP income last 2016 for a growth rate of only 5.8%. In terms of this parameter, a value investor may find this share to be a bit overvalued since the PEG ratio is already more than 1. Fair value stocks usually have a P/E that is equal to the growth rate.

In terms of income, the first 6 months net income attributable to parent this year drop by 7.7% in comparison to last year first 6months net income.

Disclaimer: Trade or invest at your own risk.

<P.S> Are you in Singapore? Confused and hardly able to understand what I'm talking about? Message me on facebook. 

Sunday, October 8, 2017

How Expensive is Metro Pacific Investment (MPI) now fundamentally based on their June 2017 Quarterly Report?

Metro Pacific Investments Corporation (MPI) was incorporated on March 20, 2006 as an investment holding company. The Company is organized into the following segments based on services and products: water; toll roads; power generation and distribution; healthcare services; light rail and logistics.

The Company's subsidiaries are Maynilad Water Holding Company, Inc.; Metro Pacific Tollways Corporation; Manila Electric Company; Metro Pacific Hospital Holdings, Inc.; Metro Pacific Light Rail Corporation; and MetroPac Logistics Company, Inc.

As of December 31, 2016, MPI's investments outside the Philippines include an effective ownership of 29.4% in DMT, a Thai toll road operator, and 45.0% in CII B&R, a toll road company located in Ho Chi Minh City in Vietnam.


As of Oct 06, 2017, MPI was last traded price at 6.88Php. This is just 1.37 times higher compared to their recorded book value as according to their June 2017 quarterly report. In terms of this parameter, a value investor may find the market price to be still acceptable. 

In terms of P/E, the company recorded a trailing P/E of 18.11 meaning, for every 1PHP earning last 2016, investors of this company are willing or is paying 18.11Php. In terms of P/E, it seems like it's still in the not expensive range but, let us take a look further on the company PEG ratio. With the P/E value and with a growth rate of just 11.76% from 2015 to 2016, the company trailing PEG ratio would be 1.54 which means, investors of this company are paying 18.11Php for every 1PHP income last 2016 for a growth rate of 11.76%. In terms of this parameter, a value investor may find this share to be a bit overvalued since the PEG ratio is already more than 1. Fair value stocks usually have a P/E that is equal to the growth rate.

In terms of income, the first 6 months net income attributable to parent this year increases by 12.05% in comparison to last year first 6months net income but the EPS grows only by 4%. Why is this? Well, perhaps part of the increase in income was due to the issuance of an additional share which was converted into income. 

Disclaimer: Trade or invest at your own risk.

<P.S> Are you in Singapore? Confused and hardly able to understand what I'm talking about? Message me on facebook. 

Sunday, May 14, 2017

Eagle Cement Corporation IPO, What you need to know fundamentally.

Eagle Cement Corporation is a fully integrated Filipino-owned company primarily engaged in the business of manufacturing, marketing, sale and distribution of cement. The Company has the newest, state-of-the-art, and single largest cement manufacturing plant in the Philippines. The Company is the 4th largest player in the Philippine cement industry based on sales volume, with the fastest growing market share among all competitors in the industry since it started commercial operations in 2010. The Company was incorporated and registered with the Securities and Exchange Commission (SEC) on June 21, 1995. Mr. Ramon S. Ang, directly (29.29%) and through Far East Cement Corporation (68.57%), owns majority of the issued and outstanding shares of the Company.

The Company has two (2) wholly-owned subsidiaries: South Western Cement Corporation (“SWCC”) and KB Space Holdings, Inc. (“KSHI”). SWCC is organized primarily for the manufacture and sale of cement and its by-products and owns mineral rights in Malabuyoc, Cebu. KSHI is a land holding company that owns several parcels of prime commercial land in Mandaluyong City.

The competitive strength of the Company is founded on its end-to-end production strategy which
seamlessly integrates critical raw material sourcing with modern manufacturing technology resulting to one of the most efficient cement manufacturing operations in the country. The Company has the largest integrated single plant production capacity in terms of cement output in the Philippines through its primary cement production facility located in Barangay Akle, San Ildefonso, Bulacan (the “Bulacan Cement Plant”). The Bulacan Cement Plant consists of two (2) production lines with an annual combined cement production capacity of approximately 5.1 Million MT or 130 Million bags per annum. It is strategically located near demand-centric areas and in direct proximity to rich limestone and shale reserves covered by the exclusive mineral rights of the Company. In addition, the Company also maintains a grinding and packaging facility in Limay, Bataan which can process 12 Million bags of cement per annum. Eagle Cement is currently in the process of constructing a third production line in its Bulacan Cement Plant (“Line 3”), due to be completed in 2018 which will increase its cement production capacity by 2 Million MT or about 50 Million bags per annum. This will bring total production capacity to about 7.1 Million MT or about 180 Million bags per annum, enabling the Company to consolidate its position as one of the leaders in the cement industry.

The Cebu Cement Plant will be a fully integrated plant built to manufacture cement using the raw materials to be extracted under the MPSAs of the Company in the province of Cebu. The plant will use approximately 2.5 Million tonnes of limestone per annum which will produce an estimated 1.5 Million tonnes to 2.0 Million tonnes of cement. Majority of the cement produced will be dispatched from the plant by sea to a network of bulk cement distribution terminals across the Visayas and Mindanao. Production in the Cebu Cement Plant is expected come on stream in 2020.

Eagle Cement currently distributes its products in the Luzon region which constitute about 65% of total cement demand in the Philippines, particularly in the following areas: National Capital Region (Metro Manila), Region I (Ilocos Norte, Ilocos Sur, La Union, Pangasinan), Region II (Batanes, Cagayan, Isabela, Nueva Vizcaya, and Quirino), Region III (Nueva Vizcaya, Nueva Ecija, Bulacan, Pampanga, Tarlac, Bataan, Zambales), and Region IVA (Cavite, Laguna and Batangas, Rizal, and Quezon) . As of 2015, NCR still serves as the center of construction and infrastructure activity in the country. Eagle Cement is considered one of the leading players in areas with the highest economic activity in the Philippines with an estimated market share of 30% in NCR, Region III, and Region IVA, based on internal Company data. As of the date of this Prospectus, the Company does not sell its products in other countries.

Click this link to see the prospectus.

Eagle offer price was adjusted from 16Php at 15Php, the price is being offered from May 11, 2017, to May 16, 2017, and will be tentatively listed on May 29, 2017. But, how reasonable is the offer price based on their financial standing? Do note that some of the factors that likely play a larger role in IPO valuation are not the numbers or financial projection but, how the company's story or its qualitative elements are being presented to the public. Sometimes, these are even more powerful than the revenue projection and financials, this article will be based only on their financial standing.

Eagle book value from 2014 to 2016 increases on average of 28.78%. The offer price if based on their 2016 book value would be 4 times higher than its book value per common outstanding share. I guess, the company believe that they are worth 4 times than their book value per share. But, will the investors share the same sentiment as Eagle? I guess we'll find out when it's finally listed. 

In terms of earning, the net income from 2014 to 2016 increased on average of 13.48%. The offer price would give 18.03 price to earning ratio (P/E) basing from their 2016 net income. Meaning, investors of this company are enticed to buy 18.03Php for every 1Php earning last 2016. With a 18.03 P/E and with earning per common outstanding share (EPS) growth rate of 11.06% from 2015 to 2016, the company PEG ratio would be 1.56 which means, investors to be of this company are enticed to pay 18.03Php for every 1Php income last 2016 for an 11.06% EPS growth rate from 2015 to 2016. A fair valued stock usually has PEG ratio of 1 meaning, what you are paying for that earning (P/E) is equivalent to the growth rate (increase in EPS).

Click here to like the facebook page and be updated. Share if this helps you

Disclaimer: Trade or invest at your own risk.
Friday, May 5, 2017

Know Your Stocks - How Expensive is SM Investment Corp. (SM) fundamentally based from their Dec 2016 Annual Report?

SM Investments Corporation (SM) was incorporated on January 15, 1960 to serve as the holding company of the SM Group of Companies. For management purposes, SM is organized into business units based on products and services. As a result of the property group corporate restructuring in 2013, SM changed the presentation of its segment information and has identified three reportable operating segments as follows: property, retail, and financial services and others.

The property segment is involved in mall, residential and commercial development and hotels and convention centers operations. The retail segment is engaged in the retail/wholesale trading of merchandise such as dry goods, wearing apparels, food and other merchandise. The financial services and others segment primarily includes the Company which engages in asset management and capital investments, and associates which are involved in financial services.

The Company is engaged in businesses through its subsidiaries, namely: retail ("The SM Store", "SM Supermarkets", "SM Hypermarkets", "SaveMore" and Waltermart Supermarket, Inc.); property (SM Prime Holdings, Inc.); financial services (BDO Unibank, Inc. and The China Banking Corporation); and others (Belle Corporation, Atlas Consolidated Mining & Development Corporation, and The Net Group).

On February 29, 2016, the Board of SM approved the merger of its retail arm, SM Retail Inc., with several related retail companies. The related companies operate local retail chains including "Ace Hardware"; "SM Appliance Center"; "Homeworld"; "Our Home"; "Toy Kingdom"; "Watsons"; "Kultura"; "Baby Company"; "Sports Station"; and several other specialty stores. The combined entity will have 1,927 outlets and 2.4 million square meter of gross floor area


As of May 04, 2017, SM was last traded price at PHP 755.00, a gained of 1.34% from the last traded price. SM is part of PSE index with a percent weight of 10.86% meaning, of all the 30 companies within PSE index, SM effect on PSEi movement is the highest. 

The current market price of this company is 2.19 times higher compared to their recorded book last December 2016, not yet expensive for most value investor since a PBV of more than 3 is considered expensive. In terms of P/E, the company recorded a trailing P/E of 29.15 meaning, for every 1PHP earning last 2016, investors of this company are willing or is paying 29.15Php. With a 29.15 P/E and with growth rate of 7.6% from 2015 to 2016, the company trailing PEG ratio would be 3.83 which means, investors of this company are paying 29.15Php for every 1Php income last 2016 for a 7.6% growth rate only from 2015 to 2016. A fair valued stock usually has PEG ratio of 1 meaning, what you are paying for that earning- the P/E is equivalent to the growth rate- increase in EPS.

Click here to like the facebook page and be updated. Share if this helps you

Disclaimer: Trade or invest at your own risk.

Thursday, May 4, 2017

Know Your Stocks - How Expensive is Apex Mining Co. Inc, (APX) fundamentally based from their Dec 2016 Annual Report?

Apex Mining Company, Inc. (APX) was incorporated on February 26, 1970 primarily to carry on the business of mining, milling, concentrating, converting, smelting, treating, preparing for market, manufacturing, buying, selling, exchanging and otherwise producing and dealing in gold, silver, copper, lead, zinc brass, iron, steel and all kinds of ores, metals and minerals. The Company's operation is situated in the municipalities of Maco and Mabini, Compostela Valley.

In February 2012, the Company unveiled Apex 3000, the project which was created to help expand the Company's current processing capacity of 850 tons per day (TPD) to 3,000 TPD by the end of 2013. However, In December 2013, the Board of APX approved a new, more realistic expansion program considering the ore deposit at the underground mines in Maco, Compostela Valley, which will increase the capacity of Maco Mines from 850 TPD to 1,500 TPD. The Company's mine produces bullion containing gold and silver, all of which are smelted in Hongkong through Heraeus Limited.

On September 11, 2014, the Board approved the purchase of Monte Oro Resources & Energy, Inc. (MORE). MORE owns Paracale Gold Ltd. which, through a subsidiary, owns a mineral processing plant in Camarines Norte and 40% of Bulawan Mineral Resources Corporation; among others.

On June 24, 2015, the Company acquired 98% of the total outstanding capital stock of Itogon-Suyoc Resources (ISRI). ISRI is a holder of four Patented Mineral Claims and owns the mill and production facilities in Sangilo. Itogon, Benguet.


As of May 03, 2017, APX was last traded price at PHP 1.88, one of the top gainers with an 18.24% increase from the last traded price. The current market price is 2.44 times higher compare to their recorded book last December 2016. Not yet expensive for most value investor since a PBV of more than 3 is considered expensive.

In terms of P/E, the company recorded a trailing P/E of 31.33 meaning, for every 1PHP earning last 2016, investors of this company are willing or is paying 31.33Php. With a 31.33 P/E and with growth rate of 500% from 2015 to 2016, the company trailing PEG ratio would only be 0.06 which means, investors of this company are paying 31.33Php for every 1Php income last 2016 for a 500% growth rate from 2015 to 2016, quite a bargain if based on this parameter. A fair valued stock usually has PEG ratio of 1 meaning, what you are paying for that earning- the P/E is equivalent to the growth rate- increase in EPS.

Click here to like the facebook page and be updated.

Disclaimer: Trade or invest at your own risk.

Advertisement

Advertisement
Click the picture to be redirected to facebook page