Showing posts with label Stock Market. Show all posts

Tuesday, July 7, 2020

Is FGEN fundamentally and technically sound to buy based on their March 2020 financial report and current price?

First Gen Corporation (FGEN) was incorporated and registered with the Securities and Exchange Commission on December 22, 1998. FGEN and its subsidiaries are involved in the power generation business. FGEN is the largest clean and renewable Independent Power Producer in the Philippines, with a total installed capacity of 3,490 MW as of December 31, 2018. 


The Company owns power plants which utilize natural gas, geothermal, wind, hydro and solar power, all of which are operational and majority-owned and controlled by the Company through its subsidiaries. These subsidiaries include First Gas Power Corporation, FGP Corp., First NatGas Power Corp., Prime Meridian Powergen Corporation, FG Bukidnon Power Corporation, and Energy Development Corporation.


As of December 31, 2018, First Philippine Holdings Corporation directly and indirectly owns 66.98% of the common shares of FGEN and 100% of FGEN's voting preferred shares. Lopez, Inc. is the ultimate parent company of FGEN.


As of July 6, 2020, FGEN was last traded at 25.7php per share or 0.52USD. What valuation can we get from their March 2020 quarterly report?

Trailing P/E: 0.52/0.07= 7.4 Indicating that for every 1USD income last 2019, investors are willing to pay or is paying 7.4USD. It is said that an overvalued company would be the one trading at a rate that’s 50 times earnings, or this could be a gauge on how optimistic are investors on this company. A lower P/E may imply low in optimism perhaps due to lower expectation on future earning. 


For a growth rate of 40% (change in EPS from 2018 to 2019), the PEG ratio would be 7.4/40=0.19 meaning, investors are paying 7.4USD relative to the growth rate of 40% from 2018 to 2019. A PEG ratio of less than 1 is usually considered undervalued.


Price to Book Value per share (P/B) = 0.52/0.61= 0.8, meaning, the current market price per share is 14.7% lower compare to the real worth of the company as based on their March 2020 financial report. A P/B of less than 3 is potentially undervalued


The first 3 months net income dropped by 19.6%. 


Fundamentally, based on the parameters above, this share seems to be a good buy.


However technically, the MACD histogram seems to indicate a decline in momentum  prompting profit taking. Meanwhile, RSI also already reach the overbought level signalling a downward momentum


Disclaimer: Trade or invest at your own risk.

Friday, July 3, 2020

Is DITO fundamentally and technically sound to buy?

DITO CME Holdings Corp. (DITO), formerly ISM Communications Corporation (ISM), was originally a mining company incorporated in March 1925 under the name Itogon-Suyoc Mines, Inc. As ISM, the Company was engaged in information technology, multimedia telecommunications, and other similar industries. On March 6, 2020, the Securities and Exchange Commission (SEC) approved the change in corporate name to the present one. 


DITO currently has no operating business. The Company is doing business as a holding company as it was since 2016.


On December 10, 2019, the Board of DITO approved the acquisition of Udenna Communications Media and Entertainment Holdings Corp.


As of July 2, 2020, DITO was last traded at 3.44php per share. Its market price is 51.4% lower from its 52 week high. Is this fundamentally cheap and technically time to buy? 

Trailing P/E is negative because of the loss in income last 2019 and even in 2018. Investors buying stock in a company with a negative P/E should be aware that they are buying shares of an unprofitable company and be mindful of the associated risks. 


Technically, the MACD histogram is indicating a decline in momentum, thus we might see a continuation in profit taking, the same goes with RSI indicator.


Disclaimer: Trade or invest at your own risk.

Tuesday, June 30, 2020

How expensive is BDO fundamentally based on their March 2020 financial report?

BDO Unibank Inc. (BDO), originally known as Acme Savings Bank, was acquired by the SM Group in 1976. BDO listed its shares on the Philippine Stock Exchange on May 21, 2002. The Company merged with Equitable PCI Bank in May 2007. 


BDO offers an array of products and services, i.e. retail banking; lending (corporate, commercial, consumer, and SME); treasury; trust; credit cards; corporate cash management; and remittances. Through its subsidiaries, the Company offers leasing and financing; investment banking; private banking; bancassurance; insurance brokerage; and stock brokerage services.


The Company's local subsidiaries include BDO Private Bank, Inc.; BDO Leasing and Finance, Inc.; BDO Capital & Investment Corporation; BDO Nomura Securities, Inc.; and BDO Insurance Brokers, Inc. The Company also has foreign subsidiaries in the US, Hong Kong, Italy, Japan, Canada, and Macau. The Company's associates include NLEX Corporation; SM Keppel Land, Inc.; Northpine Land Inc.; Taal Land, Inc.; and MMPC Auto-Financial Services Corporation.


As of December 31, 2018, BDO has 1,309 operating domestic branches (inclusive of one branch each in Hong Kong and Singapore), 4,325 automated teller machines and 484 cash deposit machines.


As of June 29, 2020, BDO was last traded at 94PHP per share. Its market price is  41.9% lower from its 52 week high. Is this fundamentally cheap and technically time to buy? 


Trailing P/E = 9.4 Indicating that for every 1php income last 2019, investors are willing to pay 9.4php.


Trailing PEG Ratio = 0.3, meaning, investors are willing or is paying 9.4php for every peso income last 2019 relative to growth growth rate of 35.4% which is the change of EPS from 2018 to 2019. A PEG ratio of less than 1 is considered undervalued.


Price to Book Value per share (P/B) = 1.1, meaning, the current market price per share is just 1.1 times higher that the real worth of the company as based on their March 2020 financial report. Usually, a P/B of less than 3 is considered undervalued.


Technically, the MACD momentum is in selling signal. RSI also is indicating a continuation of selling.  If I’m the investor, I would wait first for a sign of momentum reversal and not enter yet, but fundamentally, this is a good stock to accumulate. 


Disclaimer: Trade or invest at your own risk.

Thursday, June 18, 2020

How expensive is Ayala Corporation (AC) fundamentally based on their March 2020 financial report?


Ayala Corporation (AC) was founded in 1834, incorporated on January 23, 1968, and was listed on the Philippine Stock Exchange in 1976. AC is the holding company of the Ayala Group of Companies, with principal business interests in real estate and hotels; financial services and insurance; telecommunications; water infrastructure; electronics solutions and manufacturing; power generation; transport infrastructure; automotive; international real estate; healthcare; education; and technology ventures.


The significant subsidiaries of AC as of December 31, 2018, are Ayala Land, Inc.; Manila Water Company, Inc.; Integrated Micro-Electronics, Inc.; AC Energy, Inc.; and AC Industrial Technology Holdings Inc.


As of June 17, 2020, AC was last traded at 790.5PHP per share. The company is one of the PSE index company and top gainers from yesterday’s trading. Its market price dropped by at least 20% from its 52 week high, largely because of the COVID19 pandemic. But is it now fundamentally cheap to buy? 


In terms of P/E, AC recorded a trailing P/E of 14.6, meaning, for every 1PHP earning last 2019, investors of this company are willing or are paying 14.6Php. With 14.6 P/E and with a growth rate of 10.9% (change in EPS) from 2018 to 2019, the company trailing PEG ratio would be 0.36 which would be considered undervalued, typically, a PEG ratio of less than is in the category of undervalued.


In terms of price to book value per share, the current market price is currently 1.6 times higher than the book value as recorded in their March 2020 financial report, meaning, the company is perceived to be just 1.6 times higher compared to the real worth of the company. In terms of this parameter, It’s also undervalued, typically, PBV of less than 3 is considered undervalued.


In terms of income, as per their March 2020 financial statement, expectedly, it dropped by 17%.


Is this a good stock to accumulate fundamentally in this pandemic period? Based on the parameters above, it suggests that it’s fundamentally cheap to buy in this period. 


Disclaimer: Trade or invest at your own risk.

Wednesday, October 11, 2017

How Expensive is Alliance Global Group, Inc. (AGI) now fundamentally based on their June 2017 Quarterly Report?

Alliance Global Group, Inc. (AGI) was incorporated on October 12, 1993 and listed its shares on the Philippine Stock Exchange on April 19, 1999. AGI began operations in 1994 as a glass-container manufacturer after it acquired a glass manufacturing plant in Canlubang, Laguna. In 1999, the Company obtained approval from the Securities and Exchange Commission to broaden its primary business into that of a holding company. 

AGI is presently engaged in the food and beverage business (manufacturing and trading of consumer products); real estate (investment in and development of real estate, lease of properties, hotel operations and tourism resorts business); tourism-entertainment and gaming; and quick service restaurant business.

AGI's subsidiaries include Emperador Inc.; Megaworld Corporation; Travellers International Hotel Group, Inc.; and Golden Arches Development Corporation.


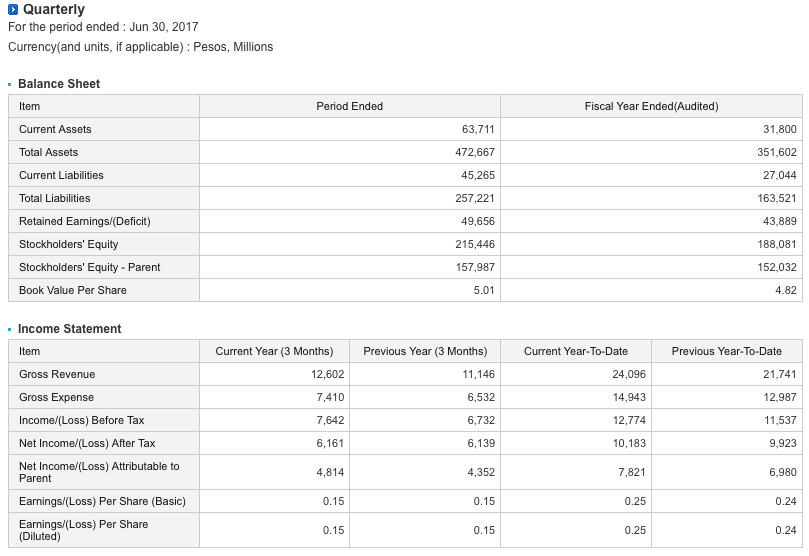
As of Oct 11, 2017, AGI was last traded price at 16.68Php. This is just 0.66 times lower compared to the recorded book value as according to their June 2017 quarterly report. In terms of this parameter, a value investor may find the market price to be quite a bargain.

In terms of P/E, the company recorded a trailing P/E of 11.42 meaning, for every 1PHP earning last 2016, investors of this company are willing or is paying 11.42Php. In terms of P/E, it seems like it's also in the range of not expensive yet but, let us take a look further on the company PEG ratio. With the P/E value and with a growth rate of just 5.8% from 2015 to 2016, the company trailing PEG ratio would be 1.97 which means, investors of this company are paying 11.42Php for every 1PHP income last 2016 for a growth rate of only 5.8%. In terms of this parameter, a value investor may find this share to be a bit overvalued since the PEG ratio is already more than 1. Fair value stocks usually have a P/E that is equal to the growth rate.

In terms of income, the first 6 months net income attributable to parent this year drop by 7.7% in comparison to last year first 6months net income.

Disclaimer: Trade or invest at your own risk.

<P.S> Are you in Singapore? Confused and hardly able to understand what I'm talking about? Message me on facebook. 

Sunday, October 8, 2017

How Expensive is Metro Pacific Investment (MPI) now fundamentally based on their June 2017 Quarterly Report?

Metro Pacific Investments Corporation (MPI) was incorporated on March 20, 2006 as an investment holding company. The Company is organized into the following segments based on services and products: water; toll roads; power generation and distribution; healthcare services; light rail and logistics.

The Company's subsidiaries are Maynilad Water Holding Company, Inc.; Metro Pacific Tollways Corporation; Manila Electric Company; Metro Pacific Hospital Holdings, Inc.; Metro Pacific Light Rail Corporation; and MetroPac Logistics Company, Inc.

As of December 31, 2016, MPI's investments outside the Philippines include an effective ownership of 29.4% in DMT, a Thai toll road operator, and 45.0% in CII B&R, a toll road company located in Ho Chi Minh City in Vietnam.


As of Oct 06, 2017, MPI was last traded price at 6.88Php. This is just 1.37 times higher compared to their recorded book value as according to their June 2017 quarterly report. In terms of this parameter, a value investor may find the market price to be still acceptable. 

In terms of P/E, the company recorded a trailing P/E of 18.11 meaning, for every 1PHP earning last 2016, investors of this company are willing or is paying 18.11Php. In terms of P/E, it seems like it's still in the not expensive range but, let us take a look further on the company PEG ratio. With the P/E value and with a growth rate of just 11.76% from 2015 to 2016, the company trailing PEG ratio would be 1.54 which means, investors of this company are paying 18.11Php for every 1PHP income last 2016 for a growth rate of 11.76%. In terms of this parameter, a value investor may find this share to be a bit overvalued since the PEG ratio is already more than 1. Fair value stocks usually have a P/E that is equal to the growth rate.

In terms of income, the first 6 months net income attributable to parent this year increases by 12.05% in comparison to last year first 6months net income but the EPS grows only by 4%. Why is this? Well, perhaps part of the increase in income was due to the issuance of an additional share which was converted into income. 

Disclaimer: Trade or invest at your own risk.

<P.S> Are you in Singapore? Confused and hardly able to understand what I'm talking about? Message me on facebook. 

Monday, October 2, 2017

How Expensive is Crown Asia Chemical Corp (CROWN) now fundamentally based on their June 2017 Quarterly Report?

Crown Asia Chemicals Corporation (CROWN) was incorporated and registered with the Securities and Exchange Commission (SEC) as Crown Asia Compounders Corporation on February 10, 1989 primarily to engage in, operate, conduct, and maintain the business of manufacturing, importing, exporting, buying, selling or otherwise dealing in, at wholesale and retail such goods as plastic and/or synthetic resins and compounds and other allied or related products of similar nature. On September 29, 2014, the SEC approved the change of the Company’s name to the present one.

In 1998, the Company began the production of PVC flexible electrical pipes. Soon after, the Company’s range of product lines expanded further with the introduction of PVC electrical conduit pipes and potable water pipes in 2000, and sanitary pipes and fittings in 2002. In 2003, the Company started to develop and market PVC compounds for use in integrated circuit (IC) packaging tubes, films and bottles, as well as door and window profiles. In 2006, CROWN explored the HDPE market by engaging in marketing and trading HDE pipes and fittings, which were supplied by and HDPE pipes manufacturer and importer. In November 2013, the Company started manufacturing its own HDPE pipes.

At present, CROWN is engaged in the production of plastic compounds, plastic pipes and other related products such as polyvinyl chloride (PVC) pellets, which are used directly and indirectly in the construction and telecommunications industries. The Company derives its revenues from the operations of its two business groups, namely, the compounds group and the pipes group. CROWN sells its compounds to manufacturers of wires and cables, IC tubes, films and sheets, and bottles, among others, while of pipes are sold to hardware dealers, wholesalers, and distributors and to bidded construction projects. 

The Company’s products are located in Guiguinto, Bulacan and in its Davao branch.


As of Sept 29, 2017, CROWN was last traded price at 1.93Php. This is just 1.25 times higher compared to their recorded book value as according to their June 2017 quarterly report. In terms of this parameter, a value investor may find the market price to be still acceptable. 

In terms of P/E, the company recorded a trailing P/E of 10.7 meaning, for every 1PHP earning last 2016, investors of this company are willing or is paying 10.7Php. In terms of P/E, it seems like it's not yet expensive but, let us take a look further on the company PEG ratio. With the P/E value and with a growth rate of just 5.88% from 2015 to 2016, the company trailing PEG ratio would be 1.8 which means, investors of this company are paying 10.7Php for every 1PHP income last 2016 for a growth rate of only 5.88%. In terms of this parameter, a value investor may find this share to be overvalued since the PEG ratio is already more than 1.

In terms of income, the first 6 months net income after tax this year increases by 4.9% in comparison to last year first 6months net income.

Disclaimer: Trade or invest at your own risk.

<P.S> Are you in Singapore? Want to learn how to read stocks fundamentally? PM me on my fb page.

Tuesday, September 19, 2017

How Expensive is Jollibee (JFC) now fundamentally based on their June 2017 Quarterly Report?

Jollibee Foods Corporation (JFC) was incorporated on January 11, 1978. JFC and its subsidiaries and affiliates are involved primarily in the development, operation and franchising of quick service restaurants (QSR) under the trade names "Jollibee", "Chowking", "Greenwich", "Red Ribbon", "Yong He King", "Hong Zhuang Yuan", "Mang Inasal", "Burger King", "Highlands Coffee", "Pho24", "12 Hotpot", "Dunkin' Donuts", and "Smashburger".

On November 18, 2016, JFC disclosed that it entered into an agreement through its subsidiary, JSF Investments Pte. Ltd. (JSF), with its JV partner, Viet Thai International Joint Stock Company (VTI), to make its JV company, Superfoods Group, a public company by listing it in the Vietnam Stock Exchange with an initial public offering (IPO) on or before July 2019. As part of the agreement to the IPO, the ownership of Superfoods Group will be adjusted with JFC, through JSF, owning 60% of the JV while VTI will own 40%.

Aside from the subsidiaries and affiliates which own and operate the JFC’s QSR trade names, the Company's other subsidiaries include Freemont Foods Corporation, a wholly-owned subsidiary which owns and operates Jollibee stores in Visayas and Mindanao, and Grandworth Resources Corporation, a real estate company which owns or leases some of the properties used as store sites.

By the end of 2016, there were 978 Jollibee stores nationwide, of which 483 were franchised and 495 are Company-owned. In international operations, Jollibee had 167 stores with 35 stores in the US, 84 in Vietnam, 26 in the Middle East, 14 in Brunei, four in Singapore, three in Hong Kong, and one in Canada.


As of Sept 19, 2017, JFC was last traded price at 244Php. This is 7 times higher compared to their recorded book value as according to their June 2017 quarterly report. A value investor may found this quite overvalued. But, perhaps because of its popularity, investors of this share perceived that the net worth of the company should be 7 times more than its current value. 

In terms of P/E, the company recorded a trailing P/E of 42.4 meaning, for every 1PHP earning last 2016, investors of this company are willing or is paying 42.4PHP. With a P/E value and with a growth rate of 24.4% from 2015 to 2016, the company trailing PEG ratio would also be 1.7 which means, investors of this company are paying 40.24PHP for every 1PHP income last 2016 for a growth rate of 24.4%. A fair valued stock usually has PEG ratio of 1 meaning, what you are paying for that earning- the P/E is equivalent to the growth rate- increase in EPS.

In terms of income, the first 6 months net income attributable to parents this year increases by 14% in comparison to last year first 6months net income.

Disclaimer: Trade or invest at your own risk.
Does this help you decide whether to buy JFC or not?

Yes
No
quotes 2 know

Sunday, September 17, 2017

How Expensive is Double Dragon (DD) now fundamentally based on their June 2017 Quarterly Report?

DoubleDragon Properties Corp. (DD), formerly Injap Land Corporation, was established on December 9, 2009 to primarily engage in the business of real estate development and other real estate-related business ventures. The Company started commercial operations in November 2010. DD was originally 100%-owned by Injap Investments, Inc. (IJI), a holding company owned by the Sia family. In June 2012, DD became a joint venture between IJI and Honeystar Holdings Corporation, the holding company of the Tan and Ang families. The Securities and Exchange Commission approved the Company's change in name to its present one on August 1, 2012.

DD and its subsidiaries own, lease, and enter into joint venture agreements covering several tracts of land for community malls, office, residential and other types of developments. As of December 31, 2016, DD has eight subsidiaries including DoubleDragon Sales Corp., DoubleDragon Property Management Corp., DD Happyhomes Residential Centers, Inc., DD-Meridian Park Development Corp., CityMall Commercial Centers Inc., Piccadilly Circus Landing Inc., Iloilo-Guimaras Ferry Terminal Corp. and Hotel of Asia, Inc.

At present, the Company has acquired a total of 54 sites for its community malls. Ten (10) CityMalls have commenced commercial operations while 29 are under construction, of which majority will be opening in 2017. Meanwhile, 15 will be completed and majority thereof will be operational by 2018.

The Company’s core projects include CityMall, DD Meridian Park, Jollibee Tower, The SkySuites Tower, Dragon8 Mall, and W.H. Taft Residences. DD also has several projects in Iloilo, namely, Injap Tower, The Uptown Place, People’s Condominium, FirstHomes Subdivision, and HappyHomes – Mandurriao.

As of Sept 15, 2017, DD was last traded price at 40Php, even though the market price dropped, it's still 8.7 times higher compared to the recorded book on their June 2017 quarterly report. A value investor may found this quite overvalued. On the other hand, investors of this share perceived that the net worth of the company should be 8.7 times more than its current value, perhaps because of the potential earning in the future, the trust on the company management or any other else like, effective marketing approach to attract investors.

In terms of P/E, the company recorded a trailing P/E of 154 meaning, for every 1Php earning last 2016, investors of this company are willing or is paying 154Php which, may be expensive. With a 154 P/E and with a growth rate of 4% from 2015 to 2016, the company trailing PEG ratio would be 38.4 which means, investors of this company are paying 154Php for every 1Php income last 2016 for a 4% growth rate from 2015 to 2016. A fair valued stock usually has PEG ratio of 1 meaning, what you are paying for that earning- the P/E is equivalent to the growth rate- increase in EPS.

Disclaimer: Trade or invest at your own risk.


Does the blog help you decide what stock to buy or sell?

Yes
No
Poll Maker

Tuesday, September 12, 2017

Know Your Stocks - How Expensive is MEG fundamentally based on their June 2017 Quarterly Report?

Megaworld Corporation was incorporated on August 24, 1989 to engage in the development of large scale, mixed-used planned communities or townships that integrate residential, commercial, leisure and entertainment components. The Company is also engaged in other property-related activities such as project design, construction oversight and property management. On August 19, 1999, the Company changed its corporate name to the present one to coincide with its conversion from a purely real estate company into a holding company, although MEG continues to focus on its core competence in real estate development.

MEG's real estate portfolio includes residential condominium units, subdivision lots and townhouses, condominium-hotel projects as well as office projects and retail spaces. The Company has three primary business segments: real estate sales of residential developments; leasing of office space, primarily to BPO enterprises, and retail space; and management of hotel operations.

Since its incorporation in 1989, the Company and its subsidiaries and associates have launched approximately 560 residential buildings, office buildings and hotels consisting in aggregate of more than 12 million square meters of floor area.

As of December 31, 2016, the Company's subsidiaries and associates include Empire East Land Holdings, Inc.; Global-Estate Resorts, Inc.; Suntrust Properties, Inc.; Richmonde Hotel Group International Limited; Bonifacio West Development Corporation; Suntrust Home Developers, Inc.; Maple Grove Land, Inc.; San Vivente Coast, Inc.; and Palm Tree Holdings & Development Corporation.


As of Sept 11, 2017, MEG was last traded price at 5.30Php, this is 1.29 times higher compared to their recorded book value as of June 2017 quarterly report. In regard to this parameter, a higher market price in comparison to company's net worth could mean the share is over valued but, it could also mean that the investors perceived the company to be worth more than its net worth due to its potential earning.

In terms of P/E, the company recorded a trailing P/E of 15.14 meaning, for every 1PHP earning last 2016, investors of this company are willing or is paying 15.14Php. With the P/E value and with growth rate of 12.90% from 2015 to 2016, the company trailing PEG ratio would be 1.17 which is more than 1.0 meaning, investors of this company are paying 15.14Php for every 1PHP income last 2016 even if the company grows a bit less than the P/E or 12.90% from 2015 to 2016. A fair valued stock usually has PEG ratio of 1 meaning, what you are paying for that earning- the P/E is equivalent to the growth rate- increase in EPS.

In terms of income, the first 6 months net income attributable to parents increased by 10.8% in comparison to last year first 6 months net income

Disclaimer: Trade or invest at your own risk.

Like and Share

Sunday, May 14, 2017

Eagle Cement Corporation IPO, What you need to know fundamentally.

Eagle Cement Corporation is a fully integrated Filipino-owned company primarily engaged in the business of manufacturing, marketing, sale and distribution of cement. The Company has the newest, state-of-the-art, and single largest cement manufacturing plant in the Philippines. The Company is the 4th largest player in the Philippine cement industry based on sales volume, with the fastest growing market share among all competitors in the industry since it started commercial operations in 2010. The Company was incorporated and registered with the Securities and Exchange Commission (SEC) on June 21, 1995. Mr. Ramon S. Ang, directly (29.29%) and through Far East Cement Corporation (68.57%), owns majority of the issued and outstanding shares of the Company.

The Company has two (2) wholly-owned subsidiaries: South Western Cement Corporation (“SWCC”) and KB Space Holdings, Inc. (“KSHI”). SWCC is organized primarily for the manufacture and sale of cement and its by-products and owns mineral rights in Malabuyoc, Cebu. KSHI is a land holding company that owns several parcels of prime commercial land in Mandaluyong City.

The competitive strength of the Company is founded on its end-to-end production strategy which
seamlessly integrates critical raw material sourcing with modern manufacturing technology resulting to one of the most efficient cement manufacturing operations in the country. The Company has the largest integrated single plant production capacity in terms of cement output in the Philippines through its primary cement production facility located in Barangay Akle, San Ildefonso, Bulacan (the “Bulacan Cement Plant”). The Bulacan Cement Plant consists of two (2) production lines with an annual combined cement production capacity of approximately 5.1 Million MT or 130 Million bags per annum. It is strategically located near demand-centric areas and in direct proximity to rich limestone and shale reserves covered by the exclusive mineral rights of the Company. In addition, the Company also maintains a grinding and packaging facility in Limay, Bataan which can process 12 Million bags of cement per annum. Eagle Cement is currently in the process of constructing a third production line in its Bulacan Cement Plant (“Line 3”), due to be completed in 2018 which will increase its cement production capacity by 2 Million MT or about 50 Million bags per annum. This will bring total production capacity to about 7.1 Million MT or about 180 Million bags per annum, enabling the Company to consolidate its position as one of the leaders in the cement industry.

The Cebu Cement Plant will be a fully integrated plant built to manufacture cement using the raw materials to be extracted under the MPSAs of the Company in the province of Cebu. The plant will use approximately 2.5 Million tonnes of limestone per annum which will produce an estimated 1.5 Million tonnes to 2.0 Million tonnes of cement. Majority of the cement produced will be dispatched from the plant by sea to a network of bulk cement distribution terminals across the Visayas and Mindanao. Production in the Cebu Cement Plant is expected come on stream in 2020.

Eagle Cement currently distributes its products in the Luzon region which constitute about 65% of total cement demand in the Philippines, particularly in the following areas: National Capital Region (Metro Manila), Region I (Ilocos Norte, Ilocos Sur, La Union, Pangasinan), Region II (Batanes, Cagayan, Isabela, Nueva Vizcaya, and Quirino), Region III (Nueva Vizcaya, Nueva Ecija, Bulacan, Pampanga, Tarlac, Bataan, Zambales), and Region IVA (Cavite, Laguna and Batangas, Rizal, and Quezon) . As of 2015, NCR still serves as the center of construction and infrastructure activity in the country. Eagle Cement is considered one of the leading players in areas with the highest economic activity in the Philippines with an estimated market share of 30% in NCR, Region III, and Region IVA, based on internal Company data. As of the date of this Prospectus, the Company does not sell its products in other countries.

Click this link to see the prospectus.

Eagle offer price was adjusted from 16Php at 15Php, the price is being offered from May 11, 2017, to May 16, 2017, and will be tentatively listed on May 29, 2017. But, how reasonable is the offer price based on their financial standing? Do note that some of the factors that likely play a larger role in IPO valuation are not the numbers or financial projection but, how the company's story or its qualitative elements are being presented to the public. Sometimes, these are even more powerful than the revenue projection and financials, this article will be based only on their financial standing.

Eagle book value from 2014 to 2016 increases on average of 28.78%. The offer price if based on their 2016 book value would be 4 times higher than its book value per common outstanding share. I guess, the company believe that they are worth 4 times than their book value per share. But, will the investors share the same sentiment as Eagle? I guess we'll find out when it's finally listed. 

In terms of earning, the net income from 2014 to 2016 increased on average of 13.48%. The offer price would give 18.03 price to earning ratio (P/E) basing from their 2016 net income. Meaning, investors of this company are enticed to buy 18.03Php for every 1Php earning last 2016. With a 18.03 P/E and with earning per common outstanding share (EPS) growth rate of 11.06% from 2015 to 2016, the company PEG ratio would be 1.56 which means, investors to be of this company are enticed to pay 18.03Php for every 1Php income last 2016 for an 11.06% EPS growth rate from 2015 to 2016. A fair valued stock usually has PEG ratio of 1 meaning, what you are paying for that earning (P/E) is equivalent to the growth rate (increase in EPS).

Click here to like the facebook page and be updated. Share if this helps you

Disclaimer: Trade or invest at your own risk.
Friday, May 5, 2017

Know Your Stocks - How Expensive is SM Investment Corp. (SM) fundamentally based from their Dec 2016 Annual Report?

SM Investments Corporation (SM) was incorporated on January 15, 1960 to serve as the holding company of the SM Group of Companies. For management purposes, SM is organized into business units based on products and services. As a result of the property group corporate restructuring in 2013, SM changed the presentation of its segment information and has identified three reportable operating segments as follows: property, retail, and financial services and others.

The property segment is involved in mall, residential and commercial development and hotels and convention centers operations. The retail segment is engaged in the retail/wholesale trading of merchandise such as dry goods, wearing apparels, food and other merchandise. The financial services and others segment primarily includes the Company which engages in asset management and capital investments, and associates which are involved in financial services.

The Company is engaged in businesses through its subsidiaries, namely: retail ("The SM Store", "SM Supermarkets", "SM Hypermarkets", "SaveMore" and Waltermart Supermarket, Inc.); property (SM Prime Holdings, Inc.); financial services (BDO Unibank, Inc. and The China Banking Corporation); and others (Belle Corporation, Atlas Consolidated Mining & Development Corporation, and The Net Group).

On February 29, 2016, the Board of SM approved the merger of its retail arm, SM Retail Inc., with several related retail companies. The related companies operate local retail chains including "Ace Hardware"; "SM Appliance Center"; "Homeworld"; "Our Home"; "Toy Kingdom"; "Watsons"; "Kultura"; "Baby Company"; "Sports Station"; and several other specialty stores. The combined entity will have 1,927 outlets and 2.4 million square meter of gross floor area


As of May 04, 2017, SM was last traded price at PHP 755.00, a gained of 1.34% from the last traded price. SM is part of PSE index with a percent weight of 10.86% meaning, of all the 30 companies within PSE index, SM effect on PSEi movement is the highest

The current market price of this company is 2.19 times higher compared to their recorded book last December 2016, not yet expensive for most value investor since a PBV of more than 3 is considered expensive. In terms of P/E, the company recorded a trailing P/E of 29.15 meaning, for every 1PHP earning last 2016, investors of this company are willing or is paying 29.15Php. With a 29.15 P/E and with growth rate of 7.6% from 2015 to 2016, the company trailing PEG ratio would be 3.83 which means, investors of this company are paying 29.15Php for every 1Php income last 2016 for a 7.6% growth rate only from 2015 to 2016. A fair valued stock usually has PEG ratio of 1 meaning, what you are paying for that earning- the P/E is equivalent to the growth rate- increase in EPS.

Click here to like the facebook page and be updated. Share if this helps you

Disclaimer: Trade or invest at your own risk.

Thursday, May 4, 2017

Know Your Stocks - How Expensive is Apex Mining Co. Inc, (APX) fundamentally based from their Dec 2016 Annual Report?

Apex Mining Company, Inc. (APX) was incorporated on February 26, 1970 primarily to carry on the business of mining, milling, concentrating, converting, smelting, treating, preparing for market, manufacturing, buying, selling, exchanging and otherwise producing and dealing in gold, silver, copper, lead, zinc brass, iron, steel and all kinds of ores, metals and minerals. The Company's operation is situated in the municipalities of Maco and Mabini, Compostela Valley.

In February 2012, the Company unveiled Apex 3000, the project which was created to help expand the Company's current processing capacity of 850 tons per day (TPD) to 3,000 TPD by the end of 2013. However, In December 2013, the Board of APX approved a new, more realistic expansion program considering the ore deposit at the underground mines in Maco, Compostela Valley, which will increase the capacity of Maco Mines from 850 TPD to 1,500 TPD. The Company's mine produces bullion containing gold and silver, all of which are smelted in Hongkong through Heraeus Limited.

On September 11, 2014, the Board approved the purchase of Monte Oro Resources & Energy, Inc. (MORE). MORE owns Paracale Gold Ltd. which, through a subsidiary, owns a mineral processing plant in Camarines Norte and 40% of Bulawan Mineral Resources Corporation; among others.

On June 24, 2015, the Company acquired 98% of the total outstanding capital stock of Itogon-Suyoc Resources (ISRI). ISRI is a holder of four Patented Mineral Claims and owns the mill and production facilities in Sangilo. Itogon, Benguet.


As of May 03, 2017, APX was last traded price at PHP 1.88, one of the top gainers with an 18.24% increase from the last traded price. The current market price is 2.44 times higher compare to their recorded book last December 2016. Not yet expensive for most value investor since a PBV of more than 3 is considered expensive.

In terms of P/E, the company recorded a trailing P/E of 31.33 meaning, for every 1PHP earning last 2016, investors of this company are willing or is paying 31.33Php. With a 31.33 P/E and with growth rate of 500% from 2015 to 2016, the company trailing PEG ratio would only be 0.06 which means, investors of this company are paying 31.33Php for every 1Php income last 2016 for a 500% growth rate from 2015 to 2016, quite a bargain if based on this parameter. A fair valued stock usually has PEG ratio of 1 meaning, what you are paying for that earning- the P/E is equivalent to the growth rate- increase in EPS.

Click here to like the facebook page and be updated.

Disclaimer: Trade or invest at your own risk.

Monday, April 24, 2017

Know Your Stocks - How Expensive is PGOLD fundamentally based from their Dec 2016 Annual Report?

Puregold Price Club, Inc. (PGOLD) was incorporated on September 8, 1998 as a company involved in the business of trading goods such as consumer products on a wholesale and retail basis. The Company opened its first store in Mandaluyong City in December 1998. PGOLD's loyalty program, "Tindahan ni Aling Puring", was launched in 2004.

The Company conducts its operations through several retail formats and store brands. Hypermarkets, through "Puregold Price Club", offer a broad variety of food and non-food products and generally cater to both retail customers and resellers such as members of the Company's loyalty program. Supermarkets, through "Puregold Junior", operate as a neighborhood store which offers a higher proportion of food to non-food products vis-à-vis the Company's hypermarkets. Discounters, through "Puregold Extra", operate in a small store format that offers a more limited number of goods.

PGOLD also owns the S & R Membership Shopping (S&R) brand, which has a warehouse club concept where most of the products offered are in club packs; and Estenso Equities, Inc., which is the holding company for five companies namely, NE Daily Commodities and First Lane; PG Lawson, Inc.; Ayagold Retailers, Inc.; Gold Tempo Company; and San Roque Supermarkets. PPCI Subic, Inc. is operating one Puregold branch in Subic Bay, Olongapo City.

As of December 31, 2015, PGOLD is operating 135 hypermarkets, 93 supermarkets, 28 extras, 10 S&R warehouse clubs and 16 S&Rs - Quick Service Restaurants for a total of 282 stores all over the country.


PGOLD was recently became part of PSE index with a percent weight of 1.06% meaning, of all the 30 companies within PSE index, PGOLD effect on PSEi movement is only by 1.06%.
As of April 21, 2017, PGOLD was last traded price at PHP 41.75, this is 2.67 times higher compare to their recorded book last December 2016, not that expensive yet for most value investor since a PBV of more than 3 is considered expensive.
In terms of P/E, the company recorded a trailing P/E of 20.88 meaning, for every 1PHP earning last 2016, investors of this company are willing or is paying 20.88Php. With a 20.88 P/E and with growth rate of 10.5% from 2015 to 2016, the company trailing PEG ratio would be 1.99 which means, investors of this company are paying 20.88Php for every 1Php income last 2016 for a 10.5% growth rate from 2015 to 2016. A fair valued stock usually has PEG ratio of 1 meaning, what you are paying for that earning- the P/E is equivalent to the growth rate- increase in EPS.
Click here to like the facebook page and be updated.

Disclaimer: Trade or invest at your own risk.

Sunday, April 23, 2017

How Expensive is Double Dragon (DD) now fundamentally based from their Dec 2016 Annual Report?

DoubleDragon Properties Corp. (DD), formerly Injap Land Corporation, was established on December 9, 2009 to primarily engage in the business of real estate development and other real estate-related business ventures. The Company started commercial operations in November 2010. DD was originally 100%-owned by Injap Investments, Inc. (IJI), a holding company owned by the Sia family. In June 2012, DD became a joint venture between IJI and Honeystar Holdings Corporation, the holding company of the Tan and Ang families. The Securities and Exchange Commission approved the Company's change in name to its present one on August 1, 2012.
DD and its subsidiaries own, lease, and enter into joint venture agreements covering several tracts of land for community malls, office, residential and other types of developments. As of December 31, 2015, DD's subsidiaries include DoubleDragon Sales Corp., One Eleven Property Management Corp, Piccadilly Circus Landing Inc. (PCLI), Double Dragon Property Management Corp., DD Happyhomes Residential Centers, Inc., DD-Meridian Park Development Corp., and CityMall Commercial Centers Inc.
The Company's core projects include CityMall, DD Meridian Park, Jollibee Tower, The SkySuites Tower, Dragon8 Mall, and W.H. Taft Residences. DD also has several projects in Iloilo, namely, Injap Tower, The Uptown Place, People's Condominium, FirstHomes Subdivision, and HappyHomes - Mandurriao. DD also entered into a joint venture agreement with the City Government of Iloilo to construct and operate the Iloilo-Guimaras Ferry Terminal.
As of April 21, 2017, DD was last traded price at PHP 52.25, this is 11.7 times higher compare to their recorded book last Decemeber 2016, quite expensive for most value investor since, a PBV of more than 3 is considered expensive.
In terms of P/E, the company recorded a trailing P/E of 200.96 meaning, for every 1PHP earning last 2016, investors of this company are willing or is paying 200.96Php which is quite expensive. With a 200.96 P/E and with growth rate of 4% from 2015 to 2016, the company trailing PEG ratio would be 50.24 which means, investors of this company are paying 200.96Php for every 1Php income last 2016 for a 4% growth rate from 2015 to 2016. A fair valued stock usually has PEG ratio of 1 meaning, what you are paying for that earning- the P/E is equavalent to the growth rate- increase in EPS.
Click here to like the facebook page and be updated.
Disclaimer: Trade or invest at your own risk.

Thursday, December 22, 2016

How Expensive is Jollibee Food Corporation (JFC)? Updated 3rd Quarter

Jollibee Foods Corporation (JFC) was incorporated on January 11, 1978. JFC's principal business is the development, operation, and franchising of quick-service restaurants under the trade name "Jollibee". In the Philippines, JFC also has, as subsidiaries, Fresh N' Famous Foods, Inc., which develops, operates and franchises quick-service restaurants under the trade names "Chowking" and "Greenwich"; Red Ribbon Bakeshop, Inc., which develops, operates and franchises restaurants under the "Red Ribbon" trade name; Mang Inasal Phils., Inc. (MIPI), which develops, operates and franchises restaurants under the "Mang Inasal" trade name; and Perf Restaurants, Inc., which franchises restaurants under the "Burger King" trademark in the Philippines.

JFC also has subsidiaries and affiliates overseas which develop and operate its international brands, "Yonghe King", "Hong Zhuang Yuan", "San Pin Wang" brands under the SuperFoods Group, "12 Hotpot", "Jinja" and "Dunkin' Donuts".

On October 13, 2015, the Company's wholly-owned subsidiary, Bee Good! Inc., entered into an agreement with Smashburger Master LLC to acquire 40% of "Smashburger", a fast casual better burger brand in the US. In April 2016, JFC acquired the remaining 30% share in MIPI, making the latter wholly-owned by the Company.

By the end of 2015, there were 916 Jollibee stores nationwide, of which 459 were franchised and 457 are Company-owned. In international operations, Jollibee had 139 stores with 32 stores in the US, 72 in Vietnam, 13 in Brunei, one in Hong Kong, two in Singapore, and 19 in the Middle East.


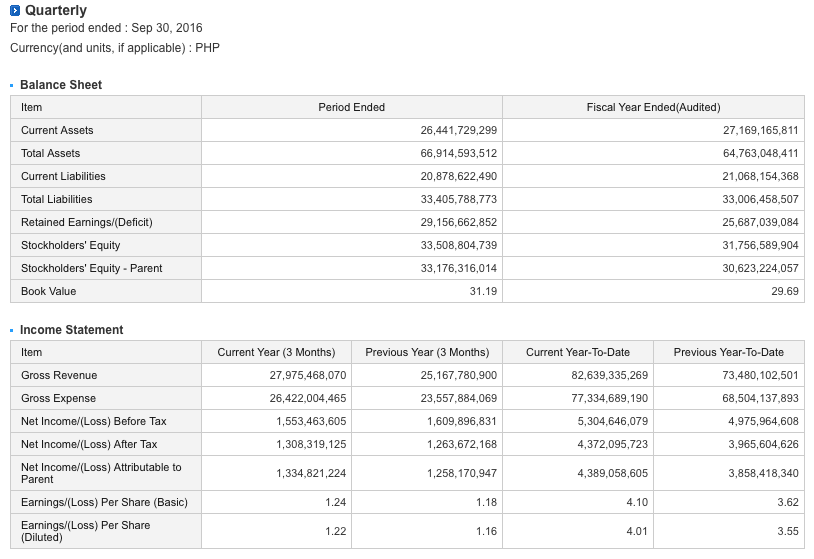
As of Dec 22, 2016, JFC was last traded price at PHP 185.50. This is 5.95 times higher compare to their recorded book value as according to their September 2016 financial report. This is expensive for most value investor since, a PBV of more than 3 is considered expensive.

In terms of P/E, the company recorded a trailing P/E of 40.24 meaning, for every 1PHP earning last 2015, investors of this company are willing or is paying 40.24PHP which is quite expensive. With a 40.24 P/E and with a negative growth since EPS dropped from 5.03 to 4.61 from 2014 to 2015 respectively, the company trailing PEG ratio would also be negative which means, investors of this company are paying 40.24PHP for every 1PHP income last 2015 even though, the company grows negatively from 2014 to 2015.

In terms of income, the first 9 months net income attributable to parents this year increases by 13.75% in comparison to last year first 9 months net income.

Disclaimer: Trade or invest at your own risk.

Monday, December 19, 2016

How Expensive is Cosco Capital, Inc. (Cosco)? 3rd Quarter Updated

Cosco Capital Inc. (COSCO), formerly Alcorn Gold Resources Corporation, was originally incorporated on January 19, 1988 with the primary purpose of engaging in exploration, development, and production of oil and gas, and metallic and non-metallic reserves in partnership with other companies or in its individual capacity. On January 13, 2000, the Securities and Exchange Commission (SEC) approved the amendment of the Company's primary purpose from an oil and mineral exploration and development corporation into a holding company.

On April 12 2013, Lucio L. Co. Group (LLCG) and COSCO executed a Deed of Agreement in payment for the subscription wherein the LLCG shall subscribe to the unissued unauthorized capital stock of the Company. Ten (10) days later, the SEC approved the change in corporate name to the present one.

COSCO, as a holding company, currently has a portfolio comprised of interests in retail, real estate and property leasing, liquor distribution, oil and mining, and specialty retail. The Company's retail interests include Puregold Price Club, Inc. and S&R Membership Shopping. COSCO's real estate and property leasing interests include Ellimac Prime Holdings, Inc., Fertuna Holding Corporation, Patagonia Holdings Corp., Nation Realty, Inc., 118 Holdings, Inc., NE Pacific Shopping Centers Corporation, and Pure Petroleum Corp. The interests of the Company in Liquor distribution include Montosco Inc., Meritus Prime Distributions, Inc., and Premier Wine and Spirits, Inc. The Company's oil and mining interests include Alcorn Petroleum and Minerals Corporation. In specialty retail, COSCO's interests include Liquigaz Philippine Corporation and Office Warehouse, Inc.


As of 19th of December 2016, COSCO was last traded price at PHP 8.53. This is 13.75% lower compare to their recorded book value as of their September 2016 financial report. Therefore, in terms of price to book value, it's not expensive yet since the book value is higher than the market price. 

In terms of P/E, the company recorded a trailing P/E of 13.76 meaning, for every 1PHP earning last 2015, investors of this company are willing or is paying 13.76PHP only. With a 13.76 P/E and with a growth rate (change in EPS) of 14.81% from 2014 to 2015, the company trailing PEG ratio would be 0.93 which is less than 1.0 meaning, investors of this company are paying only 13.76PHP for every 1PHP income last 2015 when the company grows by 14.81% from 2014 to 2015. Ideally, a fair valued stocks has a PEG ratio of 1.0 meaning, the P/E is equal to the growth rate, in the case of COSCO its less than one therefore, possibly undervalued.

In terms of income, the first 9 months net income after tax this year increases by 9.33% in comparison to last year first 9 months net income.

Disclaimer: Trade or invest at your own risk.

Tuesday, December 13, 2016

How Expensive is Cebu Air, Inc. (CEB) fundamentally? 3rd Quarter Update

Cebu Air, Inc. (CEB), which is an airline company that operates under the trade name "Cebu Pacific Air," was incorporated on August 26, 1988. The Company was granted a 40-year legislative franchise to operate international and domestic air transport services in 1991. CEB commenced its scheduled passenger operations in 1996 with its first domestic flight from Manila to Cebu. International operations began in 2001 with flights from Manila to Hong Kong.

CEB pioneered the "low fare, great value" strategy in the local aviation industry. In 2005, the Company adopted the low-cost carrier (LCC) business model, whose strategy is to offer affordable air service to passengers.

On March 20, 2014, CEB acquired 100% ownership of Tiger Airways Philippines, including a 40% stake in Roar Aviation II Pte. Ltd., a wholly-owned subsidiary of Tiger Airways Holdings Limited.

CEB currently operates a fleet of 55 aircraft which comprises of eight Airbus A319, 33 Airbus A320, eight ATR 72-500, and six Airbus A330 aircrafts. It operates its Airbus aircraft on both domestic and international routes.

As of December 31, 2015, the Group operates an extensive route network serving 56 domestic routes and 41 international routes with a total of 2,685 scheduled weekly flights. It operates from
seven hubs located in Pasay City, Metro Manila; Lapu-Lapu City, Cebu; Clark, Pampanga; Davao City, Davao del Sur; Ilo-ilo City, regional center of western Visayas region; and Kalibo, Aklan.


As of December 13, 2016, CEB was last traded price at PHP 90.00. This is only 1.77 higher compare to their recorded book value as according to their September 2016 financial report. I guess it's not yet expensive since, for most value investor a PBV of more than 3 is already considered expensive.

In terms of P/E, the company recorded a trailing P/E of 12.43 meaning, for every 1PHP earning last 2015, investors of this company are willing or is paying 12.43Php to which is not expensive yet. With a P/E of 12.43 and a growth rate of 413.48% since EPS increases from 1.41 to 7.24 from 2014 to 2015 respectively, the company trailing PEG ratio would only be 0.03, this is way less than one therefore, not expensive. 

In terms of income, the first 9 months net income attributable to parents this year increases by 99.60% in comparison to last year first 9 months net income.

With the company current market price, the company seems to be sound fundamentally.

Disclaimer: Trade or invest at your own risk.

Advertisement

Advertisement
Click the picture to be redirected to facebook page