Friday, July 24, 2020

Is GTCAP fundamentally and technically sound to buy based on their March 2020 financial report and current price?

GT Capital Holdings, Inc. (GTCAP) was incorporated on July 26, 2007 as a holding company. GTCAP is the primary vehicle for the holding and management of the diversified business interests of the Ty family in the Philippines. The Company holds interests in banking; automotive assembly, importation, distribution, and financing; property development; life and non-life insurance; and infrastructure and utilities. 


GTCAP's subsidiaries are Federal Land, Inc.; Toyota Motor Philippines Corporation; Toyota Manila Bay Corp.; and GT Capital Auto Dealership Holdings, Inc. The Company also has significant shareholdings in Metropolitan Bank & Trust Company; Metro Pacific Investments Corporation; Philippine AXA Life Insurance Corporation; Toyota Financial Services Philippines Corporation; and Sumisho Motor Finance Corporation.


As of July 23, 2020, GTCAP was last traded at 438php per share, down by 55% compared to their 52-week high price. What valuation can we get from their March 2020 quarterly report?


Trailing P/E: 438/91.6= 4.8 Indicating that for every 1php income last 2019, investors are willing to pay or are paying 4.8php only. It is said that an overvalued company would be the one trading at a rate that’s 50 times earnings, or this could be a gauge on how optimistic are investors on this company. A lower P/E may imply low in optimism perhaps due to lower expectations on future earning, or news i.e pandemic that greatly impacts investor optimism. 


For a growth rate of 56.9% change in EPS from 2018 to 2019, the PEG ratio would be 4.8/56.9=0.08 meaning, investors are paying 4.8php per earning relative to the growth rate of 56.9% from 2018 to 2019. A PEG ratio of less than 1 is usually considered undervalued.


Price to Book Value per share (P/B) = 438/760.14= 0.57, meaning, the current market price per share is 42.4% lower compared to the real worth of the company as based on their March 2020 financial report. A P/B of less than 3 is potentially undervalued


However, due to pandemic, their first 3 months net income dropped by 25.7%


Still, fundamentally, based on the parameters above, this share seems to be a good buy to accumulate.


However technically, the MACD seems to indicate bearish momentum. RSI also continues to move to an oversold level, it may be a good strategy to buy this stock while in a bearish mode as this will definitely bounce back. Caveat 

Monday, July 20, 2020

Is ALI fundamentally and technically sound to buy based on their March 2020 financial report and current price?

Ayala Land, Inc. (ALI) was formerly the real estate division of Ayala Corporation (AC) and was incorporated on June 30, 1988 to focus on the development of its existing real estate assets. In July 1991, the Company became publicly-listed through an initial public offering of its primary and secondary shares on the Makati and Manila Stock Exchanges.


ALI is engaged in the planning and development of large scale, integrated estates having a mix of use for the sale of residential lots and buildings, office buildings and commercial and industrial lots, leasing of commercial and office spaces and the development, operation and management of hotels and resorts. The Company also develops commercial and industrial parks and is also engaged in property management, construction and other businesses like retail and healthcare. 


Among the Company's subsidiaries are Alveo Land Corporation; Avida Land Corporation; Ayala Property Management Corporation; Makati Development Corporation; North Triangle Depot Commercial Corporation; Laguna Technopark, Inc.; and Ten Knots Philippines, Inc.


As of July 17, 2020, ALI was last traded at 31.7php per share, down by 3.65% from the previous trading. What valuation can we get from their March 2020 quarterly report?


Trailing P/E: 31.7/2.25= 14 Indicating that for every 1php income last 2019, investors are willing to pay or is paying 14php. It is said that an overvalued company would be the one trading at a rate that’s 50 times earnings, or this could be a gauge on how optimistic are investors on this company. A lower P/E may imply low in optimism perhaps due to lower expectation on future earning, or news i.e pandemic that greatly impact investor optimism. 

For a growth rate of 13.6% change in EPS from 2018 to 2019, the PEG ratio would be 14/13.6=1 meaning, investors are paying 14php relative to the growth rate of 13.6% from 2018 to 2019. A PEG ratio of less than 1 is usually considered undervalued, in this case, the market price seems to be just right relative to growth rate 

Price to Book Value per share (P/B) = 31.7/16.39= 1.9, meaning, the current market price per share is around 1.9 times higher compare to the real worth of the company as based on their March 2020 financial report. A P/B of less than 3 is potentially undervalued.


However, due to pandemic, their first 3 months net income dropped by 41%, still fundamentally, based on the parameters above, this share seems to be a good buy. 


However technically, the MACD seems to indicate a bearish momentum. RSI also continues to move to an oversold level. If I’m to buy this share, I’ll wait few more trade to see whether the momentum has a sign of reversal to bullish mode.


Disclaimer: Trade or invest at your own risk.

Friday, July 17, 2020

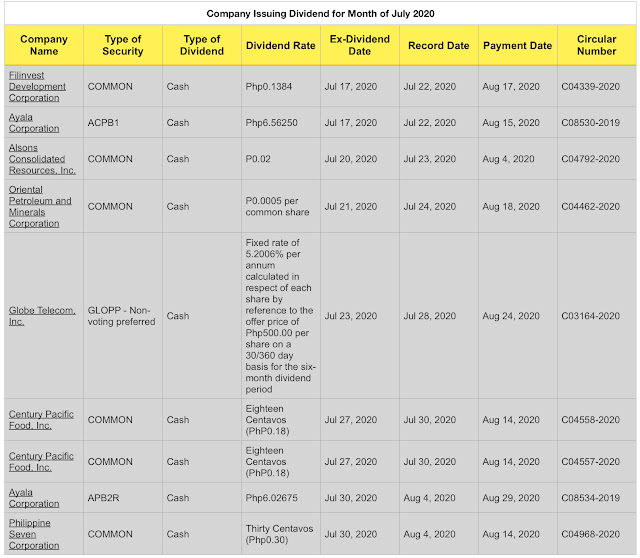
PSE Companies Issuing Dividend for Month of July 2020


Source: PSE edge


FAQ about Dividends


Q1. What is Ex dividend Date?


A1. It means the date set by the Exchange starting from which the buyer is no longer entitled to the dividends. Currently set at 3 business days before record date.


Q2: What if I buy stocks before Ex dividend date, will I be entitled for the dividend?


A2. Yes, but if you purchase a stock on the ex-dividend date or after, you will not receive the next dividend payment. Instead, the seller gets the dividend. If you purchase before the ex-dividend date, you get the dividend.


Q3: What if I buy stocks before ex dividend date but sell it before the record date or payment date, will I still be entitled for the dividend?


A3: Yes you will still be entitled, but note that by the time the stock is sold, it will decline in value by the amount of the dividend. The broker will get the commission and the buyer might just break even.


Why does the stock price decline right after the dividend is paid? Because that's the way the markets work.


Key Takeaways


- When a stock dividend is paid, the stock's price immediately falls by a corresponding amount.


- The market effectively adjusts the stock's price to reflect the lower value of the company, which could wipe out any gain sought by a short-term buyer.


- In addition, the buyer owes taxes on those dividends.


Click here for the source


Q4: What is record date?


A4: It means the date on which stockholders must officially own shares in order to be entitled to any shareholders rights or dividends, but if you buy share on this date, you will not be entitled, you must buy before ex dividend date to be entitled. 

Thursday, July 16, 2020

Is EW fundamentally and technically sound to buy based on their March 2020 financial report and current price?

East West Banking Corporation (EW) was registered with the Securities and Exchange Commission on March 22, 1993. The Company was granted authority by the Bangko Sentral ng Pilipinas (BSP) to operate as a commercial bank in 1994 and commenced operations on July 8 of the same year. 


EW's principal banking products and services include deposit-taking, loan and trade finance, treasury, trust services, credit cards, cash management and custodial services. The Company offers the financial services to consumer and corporate clients. On January 25, 2012, EW obtained from BSP the approval to operate as a universal bank.


On May 6, 2016, EastWest and Standard Chartered Bank Philippines (SCB PH) entered into an agreement for SCB PH’s retail business. Under the agreement, the credit cards, personal loans, wealth management and deposits of SCB in the Philippines will be migrated to EastWest.


The Company's wholly-owned subsidiaries are East West Rural Bank, Inc.; East West Insurance Brokerage, Inc.; Quest Marketing and Integrated Services, Inc.; East West Leasing and Finance Corporation, and Assurance Solutions Insurance Agency. EW also owns 50% of East West Ageas Life Insurance Corporation, a life insurance firm formed with Ageas Insurance International N.V.


As of December 31, 2018, EW has a network of 390 branches and 583 automated teller machines, majority of which are located within Metro Manila.


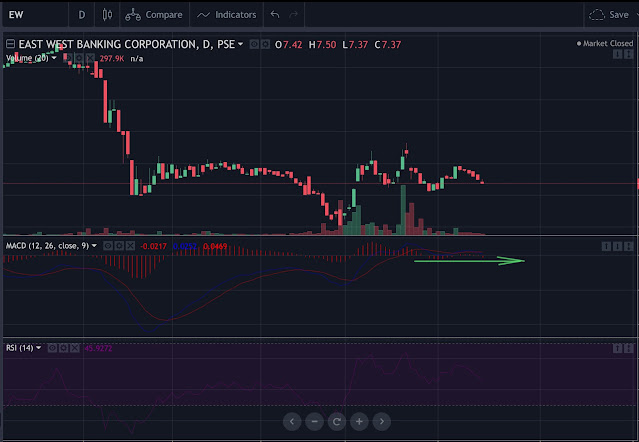
As of July 15, 2020, EW was last traded at 7.37php per share. What valuation can we get from their March 2020 quarterly report?


Trailing P/E: 7.37/2.77= 2.6 Indicating that for every 1php income last 2019, investors are willing to pay or is paying 2.6php only. It is said that an overvalued company would be the one trading at a rate that’s 50 times earnings, or this could be a gauge on how optimistic are investors on this company. A lower P/E may imply low in optimism perhaps due to lower expectation on future earning, or news i.e pandemic that greatly impact investor optimism.


For a growth rate of 38.5% change in EPS from 2018 to 2019, the PEG ratio would be 2.6/38.5=0.06 meaning, investors are paying 2.6php relative to the growth rate of 38.5% from 2018 to 2019. A PEG ratio of less than 1 is usually considered undervalued.


Price to Book Value per share (P/B) = 7.37/22.74= 0.3, meaning, the current market price per share is 67.5% lower compare to the real worth of the company as based on their March 2020 financial report. A P/B of less than 3 is potentially undervalued


In spite of pandemic, their first 3 months net income increase by 74.7%.


Fundamentally, based on the parameters above, this share seems to be a good buy to accumulate. Once the pandemic is over, this share will eventually catch up to its real worth.


However technically, the MACD histogram seems to indicate a sideway momentum. If you are into longterm investing, I suggest you accumulate this share.


Disclaimer: Trade or invest at your own risk.

Tuesday, July 7, 2020

Is FGEN fundamentally and technically sound to buy based on their March 2020 financial report and current price?

First Gen Corporation (FGEN) was incorporated and registered with the Securities and Exchange Commission on December 22, 1998. FGEN and its subsidiaries are involved in the power generation business. FGEN is the largest clean and renewable Independent Power Producer in the Philippines, with a total installed capacity of 3,490 MW as of December 31, 2018. 


The Company owns power plants which utilize natural gas, geothermal, wind, hydro and solar power, all of which are operational and majority-owned and controlled by the Company through its subsidiaries. These subsidiaries include First Gas Power Corporation, FGP Corp., First NatGas Power Corp., Prime Meridian Powergen Corporation, FG Bukidnon Power Corporation, and Energy Development Corporation.


As of December 31, 2018, First Philippine Holdings Corporation directly and indirectly owns 66.98% of the common shares of FGEN and 100% of FGEN's voting preferred shares. Lopez, Inc. is the ultimate parent company of FGEN.


As of July 6, 2020, FGEN was last traded at 25.7php per share or 0.52USD. What valuation can we get from their March 2020 quarterly report?

Trailing P/E: 0.52/0.07= 7.4 Indicating that for every 1USD income last 2019, investors are willing to pay or is paying 7.4USD. It is said that an overvalued company would be the one trading at a rate that’s 50 times earnings, or this could be a gauge on how optimistic are investors on this company. A lower P/E may imply low in optimism perhaps due to lower expectation on future earning. 


For a growth rate of 40% (change in EPS from 2018 to 2019), the PEG ratio would be 7.4/40=0.19 meaning, investors are paying 7.4USD relative to the growth rate of 40% from 2018 to 2019. A PEG ratio of less than 1 is usually considered undervalued.


Price to Book Value per share (P/B) = 0.52/0.61= 0.8, meaning, the current market price per share is 14.7% lower compare to the real worth of the company as based on their March 2020 financial report. A P/B of less than 3 is potentially undervalued


The first 3 months net income dropped by 19.6%. 


Fundamentally, based on the parameters above, this share seems to be a good buy.


However technically, the MACD histogram seems to indicate a decline in momentum  prompting profit taking. Meanwhile, RSI also already reach the overbought level signalling a downward momentum


Disclaimer: Trade or invest at your own risk.

Friday, July 3, 2020

Is MM current market price justified fundamentally?

MerryMart Consumer Corp. (MM), formerly Injap Supermart Inc., is a consumer-focused retail company principally engaged in the operation of retail stores in the supermarket and, beginning January 30, 2020, household essentials category. MM, through its subsidiary, MerryMart Grocery Centers Inc. (MMGC) intends to pioneer the franchise business model covering supermarkets and household essentials stores in the Philippines (collectively, MM and its subsidiary, MMGC, are known as the 'MM Group').


Currently, the MM Group owns and operates seven MM branches nationwide, with an aggregate selling space of 9,331 square meters. The MM Group aims to open six more MM branches by the second quarter of 2020, six additional branches by the third quarter of 2020, and have a total of 100 branches located all over the Philippines by the fourth quarter of 2021.


MM is a wholly-owned subsidiary of Injap Investments Inc., which also owns 35% of DoubleDragon Properties Corp.


As of July 2, 2020, MM was last traded at 3.29php per share. This company was recently listed last June 15, 2020, and released their first quarter report the other day. What valuation can we get from their March 2020 quarterly report?


Trailing P/E = 3.29 / 0.03 = 109.6 Indicating that for every 1php income last 12 months, investors are willing to pay or is paying 109.6php. It is said that an overvalued company would be one trading at a rate that’s 50 times earnings, or it could be an optimism whereby investors expect earnings growth in the coming quarters and, as a result, investors have been buying the stock in anticipation of its appreciation. MM nature of business is like of that PGOLD and RRHI which are companies that are already established, the P/E’s of these companies are below 20, yet MM P/E is above 100. Having said this, I say that the expectation is a bit much, thus it’s potentially overvalued.


Price to Book Value per share (P/B) = 3.29 / 0.07 = 47, meaning, the current market price per share is 47 times higher that the real worth of the company as based on their March 2020 financial report. A P/B of more than 3 is potentially overvalued.


Even though the net income for the first 3 months this year increased by 50.5% from the last year first 3 months, still, based on the P/E comparing it with established companies, the current price seems to be not justified, not to mentioned the P/B ratio.


Disclaimer: Trade or invest at your own risk.

Is DITO fundamentally and technically sound to buy?

DITO CME Holdings Corp. (DITO), formerly ISM Communications Corporation (ISM), was originally a mining company incorporated in March 1925 under the name Itogon-Suyoc Mines, Inc. As ISM, the Company was engaged in information technology, multimedia telecommunications, and other similar industries. On March 6, 2020, the Securities and Exchange Commission (SEC) approved the change in corporate name to the present one. 


DITO currently has no operating business. The Company is doing business as a holding company as it was since 2016.


On December 10, 2019, the Board of DITO approved the acquisition of Udenna Communications Media and Entertainment Holdings Corp.


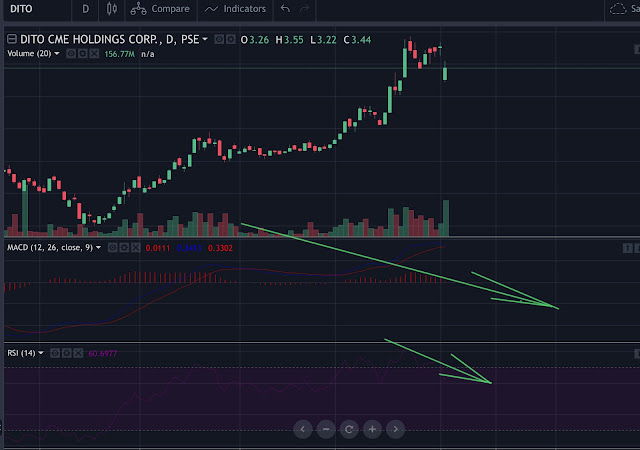
As of July 2, 2020, DITO was last traded at 3.44php per share. Its market price is 51.4% lower from its 52 week high. Is this fundamentally cheap and technically time to buy? 

Trailing P/E is negative because of the loss in income last 2019 and even in 2018. Investors buying stock in a company with a negative P/E should be aware that they are buying shares of an unprofitable company and be mindful of the associated risks. 


Technically, the MACD histogram is indicating a decline in momentum, thus we might see a continuation in profit taking, the same goes with RSI indicator.


Disclaimer: Trade or invest at your own risk.

Advertisement

Advertisement
Click the picture to be redirected to facebook page